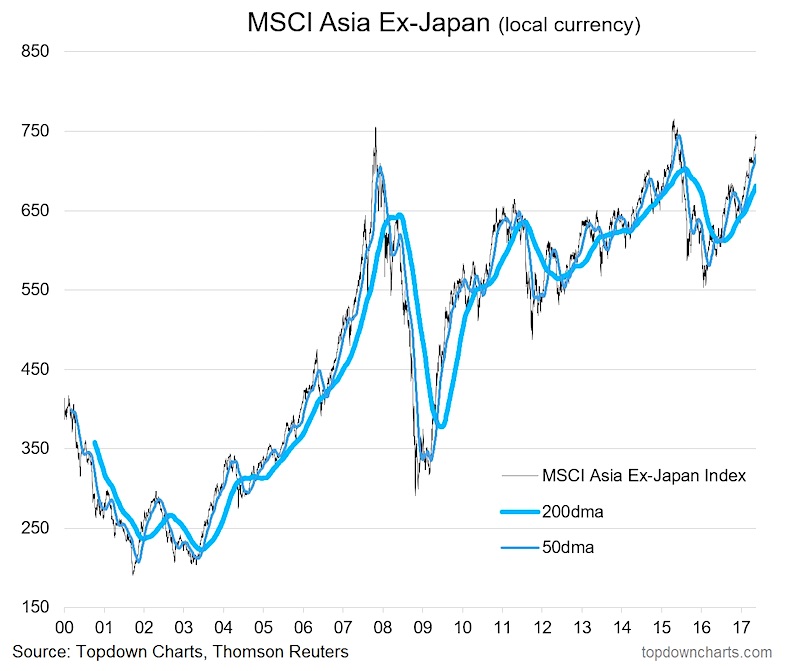
The MSCI Asia Ex-Japan Index is approaching familiar territory. The 750 level was last reached at the height of the Chinese stock bubble in 2015, and prior to that at the height of the previous Chinese stock bubble in 2007!
So the question is will the 750 level turn out to be a barrier point or a breakout point.
We looked at this question and considered a range of factors from valuation through to monetary policy and economic indicators.
First up, the chart: MSCI Asia Ex-Japan Index (in local currency terms) approaching the important 750 level.
One of the first things I look at is valuation (ok maybe second thing after a price chart catches my attention, like the one above!), and PE ratios can be useful in this respect. In our analysis we looked at forward PE ratios and while the MSCI AEJ forward PE ratio is trading towards the upper end of the historical range, it remains around 20-30% below some of the previous peaks in valuation.
Similarly on a relative value basis, it trades at around at 25% discount to developed economies (vs a longer term average discount of 15%, and vs the 2007–11 period where valuations converged). So overall there is a mildly supportive valuation case.
On monetary policy, we took a look at aggregate monetary policy rates (weighted average) across AEJ countries and found that while monetary policy is quite supportive vs history, the recent easing cycle has clearly paused. Particularly with inflation gradually trending up.
Furthermore, the cyclical economic indicators such as retail sales, exports, and industrial production look solid, after going through a soft patch in 2015/16. Importantly on the economic cycle and inflation front there are no signs that the region in aggregate is anywhere near “late cycle”, rather the positive inflation and economic growth trends should be supportive for earnings.
Thus the conclusion we reached is that while AEJ equities clearly face a test at the 750 level, odds are (all else equal – i.e. if the rest of the world behaves…..) that they will pass the test. To see the report and access the rest of the valuation and economic charts, click through to get a copy of the latest edition of the Weekly Macro Themes report.
Catch more of Callum’s insights on his blog, Top Down Charts.
Twitter: @Callum_Thomas
Any opinions expressed herein are solely those of the author, and do not in any way represent the views or opinions of any other person or entity.


