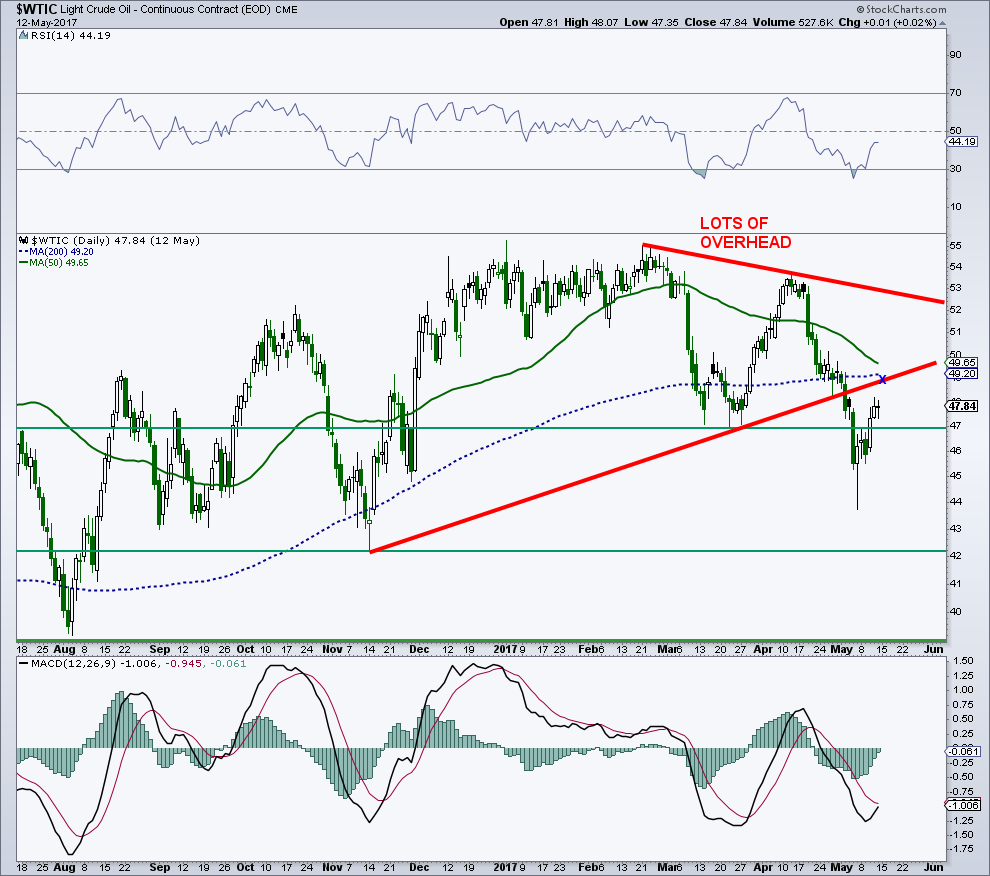
West Texas Crude Oil (WTI) is currently marching back towards that $50 level… And with the recent bounce, has seen a failed breakdown.
I have seen some positive developments, but Crude will have to over take some overhead supply if bulls want to play ball.
As you can see in the chart below, there are also bullish momentum divergences at the recent price low. It’s possible that crude traced out a 3-wave decline or ABC pattern, and could be in good shape from a price perspective for another run into the low 50’s.
There is plenty of potential resistance overhead that starts in the $49 area. Unfortunately, the COT data are still showing that commercial hedgers remain extremely bearish on crude oil, while large speculators are extremely bullish. This dichotomy in the COT data has not been a good combination historically. Waiting for the next trade to develop here.
Crude Oil (WTI) Price Chart
Feel free to reach out to me at arbetermark@gmail.com for inquiries about my newsletter “On The Mark”.
Thanks for reading.
Twitter: @MarkArbeter
Any opinions expressed herein are solely those of the author, and do not in any way represent the views or opinions of any other person or entity.


