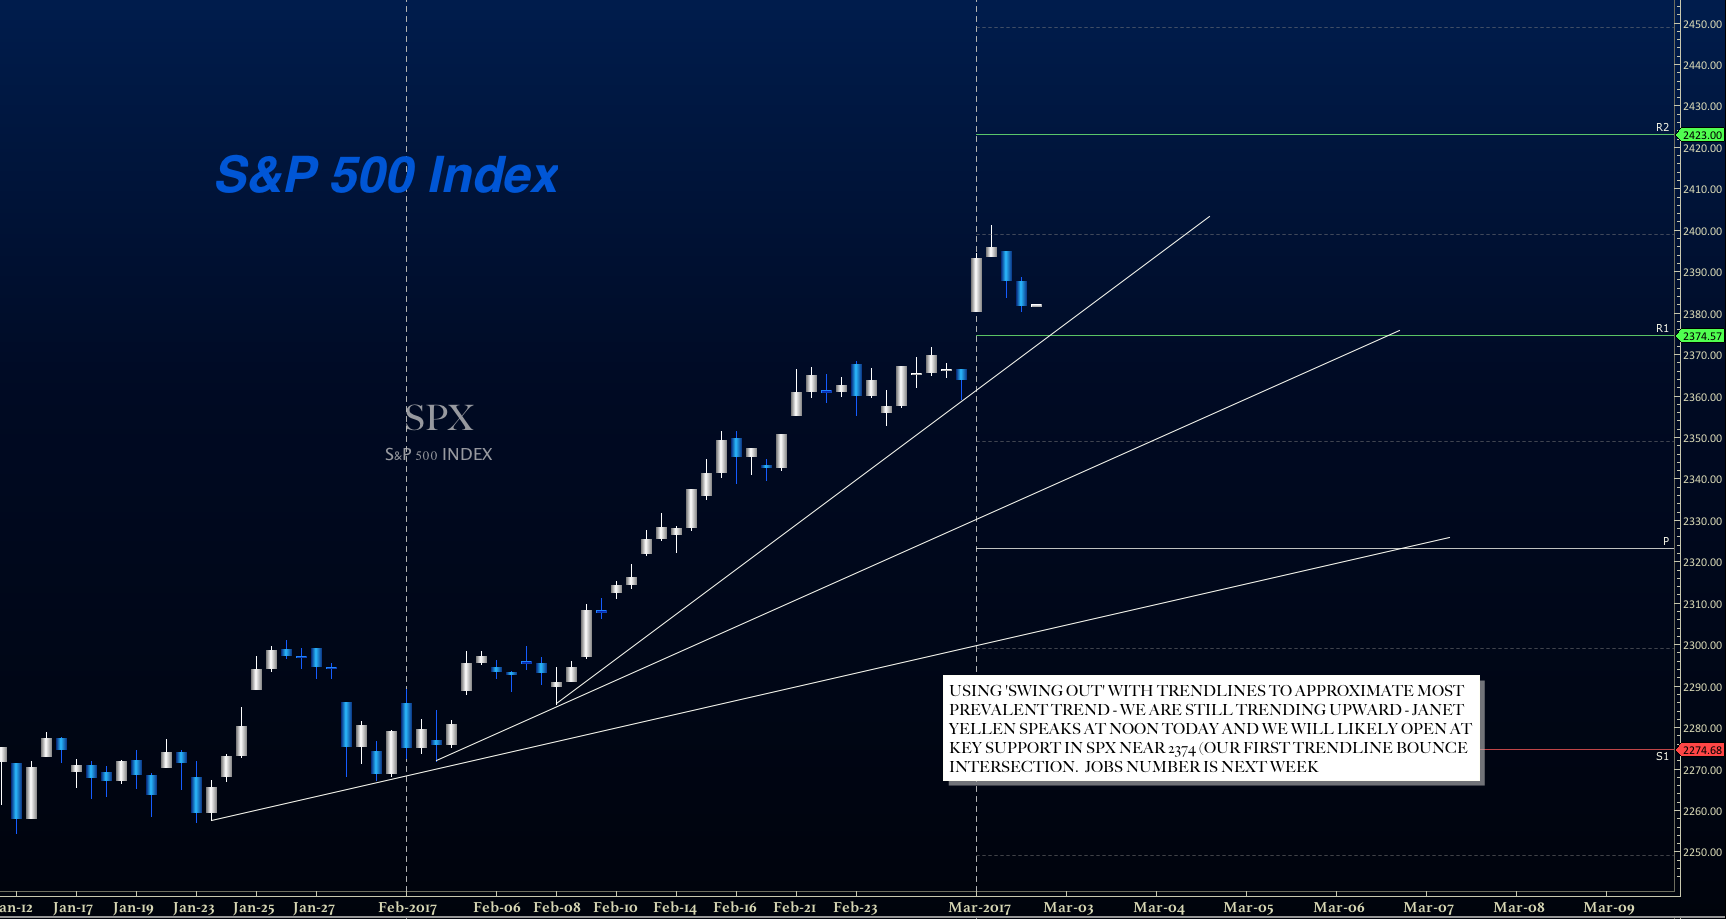
S&P 500 Market Considerations For March 3, 2017
Charts delivered a fade off the highs right into support, essentially erasing the majority of the move on the S&P 500 (INDEXSP:.INX) from Wednesday. This morning we bounced off the 2373.75 area noted yesterday. A lower high and smaller range of motion is anticipated today. Note that Janet Yellen speaks at noon.
Buying pressure will likely strengthen above a positive retest of 2400.5, while selling pressure will strengthen with a failed retest of 2373.5.
Price resistance sits near 2388 to 2396.75, with 2400.50 and 2403.25 above that. Price support holds between 2377.25 and 2373.75, with 2368 and 2359.75 below that
See today’s economic calendar with a rundown of releases.
E-mini S&P Futures Trading Setups
Upside trades – Two options for entry
- Positive retest of continuation level -2388
- Positive retest of support level– 2374.25
- Opening targets ranges – 2378, 2380.75, 2385.5,2389.75, 2393.5, 2397.75, 2400.5, 2404, 2411.75
Downside trades – Two options for entry
- Failed retest of resistance level -2385.50
- Failed retest of support level– 2372.50
- Opening target ranges – 2381.25, 2376, 2373, 2368.75, 2365, 2361.5, 2358.75, 2354.5, 2351.5, 2346.25, 2343.25, 2337.5, 2334, 2329.25
NASDAQ Futures
The NQ_F followed suit with a fade into support below the opening ranges of the chart and is also bouncing. Traders are taking profit but intraday value buyers and those who have missed most of the rally seem to be continuing to buy at support. The Nasdaq (INDEXNASDAQ:.IXIC) chart still holds bullish slant. Be careful trading against the intraday trend today.
- Buying pressure will likely strengthen with a positive retest of 5371.75
- Selling pressure will strengthen with a failed retest of 5344.5
- Resistance sits near 5382 to 5392.75, with 5400.5 and 5422.25 above that
- Support holds between 5344.75 and 5331.25, with 5327.25 and 5311.75 below that
Upside trades – Two options
- Positive retest of continuation level -5371.75
- Positive retest of support level– 5361.25
- Opening target ranges – 5364.5, 5370.75, 5374.75, 5380.75, 5384, 5388.25, 5398, 5404, 5411.5, 5422.25
Downside trades- Two options
- Failed retest of resistance level -5370.75
- Failed retest of support level– 5360.75
- Opening target ranges – 5364.5, 5361.25, 5356.5, 5348.25, 5344.75, 5336.25, 5332, 5327.75, 5323.75, 5320.75, 5318.75, 5311.75, 5306.5, 5297.75, 5294.25, 5291.25, 5286.75, 5277.75
Crude Oil –WTI
Oil traders forced crude into the deeper edges of support under heavy negative momentum. If we lose 53.5, we’ll likely see 52.2 and perhaps even 51.72. IT will be interesting to see the report that shows where big money is positioned here. It seems the herd may be in the wrong direction for now (if they are still net long), but with the range intact traders could still come out unscathed.
- Buying pressure will likely strengthen with a positive retest of 53.48
- Selling pressure will strengthen with a failed retest of 52.50
- Resistance sits near 53.8 to 54.27, with 54.56 and 55.05 above that.
- Support holds between 52.5 and 52.2, with 51.64 and 51.4 below that.
Upside trades – Two options
- Positive retest of continuation level -53.55
- Positive retest of support level– 52.84
- Opening target ranges – 53.14, 53.32, 53.48, 53.76, 54.05, 54.25, 54.4, 54.54, 53.68, 53.88, 54.05, 54.19, 54.54, 54.85, 55.04, 55.12, 55.48, 55.68, 55.88, 56.04
Downside trades- Two options
- Failed retest of resistance level -53.48
- Failed retest of support level– 53.10
- Opening target ranges – 53.3, 53.01, 52.83, 52.55, 52.4, 52.14, 52.01, 51.91, 51.72, 51.52, 51.22, 51.04, 50.82, 50.47, 50.3, and 50.16
If you’re interested in watching these trades go live, join us in the live trading room from 9am to 11:30am each trading day.
Visit TheTradingBook for more information.
If you’re interested in the live trading room, it is now primarily stock market futures content, though we do track heavily traded stocks and their likely daily trajectories as well – we begin at 9am with a morning report and likely chart movements along with trade setups for the day.
As long as the trader keeps himself aware of support and resistance levels, risk can be very adequately managed to play in either direction as bottom picking remains a behavior pattern that is developing with value buyers and speculative traders.
Twitter: @AnneMarieTrades
The author trades stock market futures every day and may have a position in mentioned securities at the time of publication. Any opinions expressed herein are solely those of the author, and do not in any way represent the views or opinions of any other person or entity.


