his post was written by Derek Benedet of Richardson GMP.
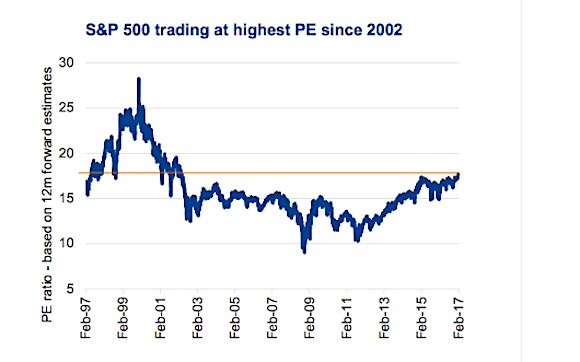
The S&P 500 (INDEXSP:.INX) is now trading at 17.7x consensus estimated earnings for the next 12 months. That is the highest valuation for the S&P since 2002, over 14 years ago. But should we care? In this edition of the weekly we will slice and dice market valuations and share some insight on the impact of future returns.
Valuations & Future Returns
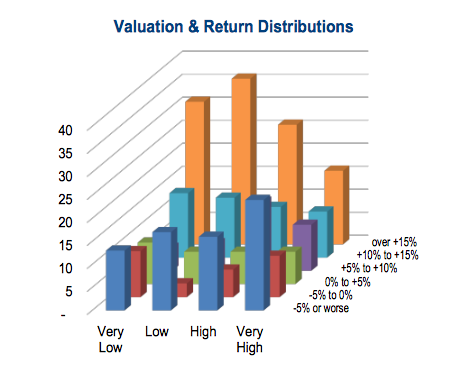
Allow me to use some simple math to mislead you. We looked at the Price-to- earnings ratio (PE) of the S&P 500 going back to 1935 and broke down the future one-year price move in the index depending on various ranges of PE ratios. When the PE ratio was below 17x the average market return was 11%, yet when the PE ratio was over 17x the average return was 6%. That may sound like valuations matter but we are hiding a lot of data and results in those averages. For instance, in 1997 when the PE was 19x, the market went 46% higher over the next year. Clearly selling due to valuations on that day would have been a poor idea. But valuations do seem to matter.
The table above breaks down all the valuations into four groups or ranges of PE, each with approximately the same number of instances. Looking at the average 12-month subsequent return, the two low valuation groups have a 12% average while the High valuation group saw lower returns at 8% and Very High has a dismal 2%. Again these are averages but adds further support that valuations matter. Yet even in the Very High valuation bucket, the market did go higher 54% of the time. The bar chart on the right shows the data a little differently. These are return distributions for each valuation bucket. When valuations are low and very low, the orange bars are bigger. That is a good thing. When valuations are very high, orange bars which represent a return over 15%, are less frequent.
Valuations do matter for future return expectations, but it is anything but cut and dry.
Digging Deeper
Aggregate index valuations are one thing, but as we know you can hide or miss a lot of information with averages. To get a better understanding of valuations, we looked back over the past three years at both the sector and individual company level.
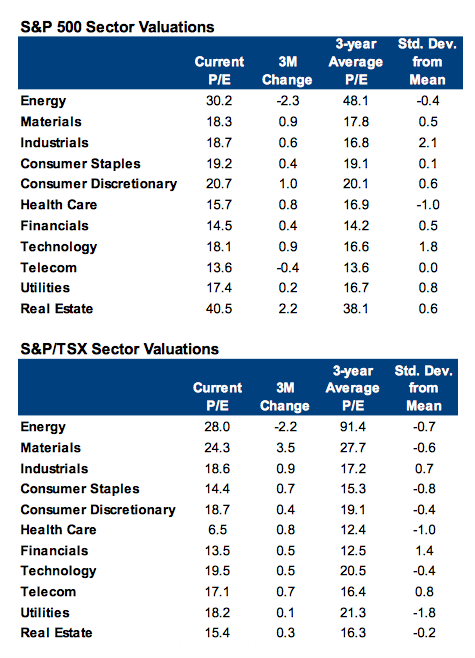
In the U.S. eight out of eleven GICS sectors are currently trading above their three-year average forward P/E ratio (top table). Energy, Health Care and Telecom sectors are currently the only ones that are trading below their three- year average. We should put an asterisk next to Energy however. The rough patch for oil prices the past couple of years suppressed company earnings which resulted in P/E ratios spiking higher, hitting a high of 146. This in turn has driven up the average making the lookback for this sector in particular a little irrelevant. The same can’t be said for the Health Care and Telecom sectors, which make the current discount to historical averages interesting. When markets are stretched as they are, lower valuations can add a nice margin of safety.
Not surprisingly, the sectors with the most optimism surrounding it are also the most expensive: Industrials (NYSEARCA:XLI) and Technology (NYSEARCA:XLK). Interestingly Financials (NYSEARCA:XLF) despite their impressive rally over the past three months are only trading slightly more expensive than average. There may be room to run with these stocks.
In Canada, generally speaking valuations across the various sectors are actually a little more reasonable. Interestingly only three sectors are trading above their three year averages. Though, as mentioned above Energy (NYSEARCA:XLE) and also Materials (NYSEARCA:XLB) in our case should have a special asterisk next to them. Canadian Financials are the most stretched, currently trading at 13.5x forward earnings, 1.4 standard deviations above their three year average. The Utilities sector is trading at the largest discount at 18.2x forward earnings. Though for a slow growing Utilities, this valuation is still tough to stomach.
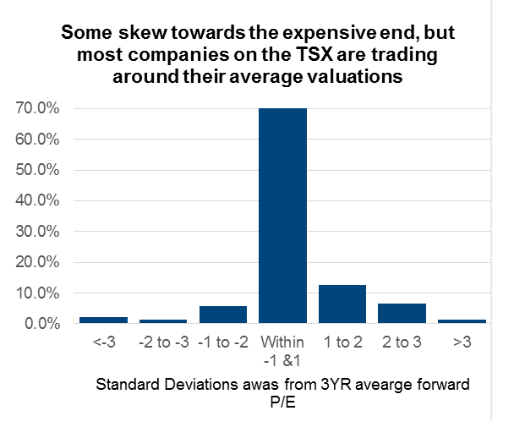
At a company level, the large majority are trading fairly close to their three-year average. 70% of companies listed on the S&P TSX have valuations within +/-1 standard deviation (bottom chart). We do see a skew towards higher valuations with over 20% of companies trading above one standard deviation above average and 8% trading below one standard deviation.
So what does it mean? Well the stock slump from a year ago is now a far off distant memory. In aggregate, investors are now paying the most for a dollar of earnings in over a decade. Yet we would not call the current valuation level extreme but certainly not cheap. It is interesting that once you start digging deeper at the sector and company levels, there are areas of cheaper valuations.
Thanks for reading.
Charts are sourced to Bloomberg unless otherwise noted.
Twitter: @sobata416 @ConnectedWealth
Any opinions expressed herein are solely those of the authors, and do not in any way represent the views or opinions of any other person or entity.

