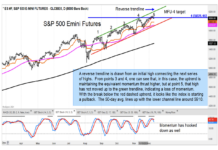
Forward progress for the stock market was halted in mid-December and since the peak the popular averages have traded in a very narrow range amidst elevated investor sentiment.
What Gives?
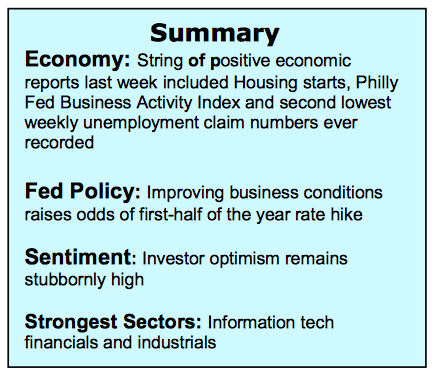
The post-election rally was interrupted when stocks became over-bought and uncertainty surfaced surrounding the timing tax of reform and other fiscal measures expected to boost the economy. There is also worry that tighter monetary policy and a strong dollar will offset much of the stimulus.
Under the surface, however, the protracted sidewise movement in stocks has helped relieve the overbought condition while a wave of favorable economic data the past two weeks has softened concerns over the health of the economy. It is encouraging that the stock market has significantly avoided the post-election noise. The S&P 500 (INDEXSP:.INX) is up more than 6.0% since November 8 and single-session pullbacks have been limited to no more than 1.00% the past two months. Although the equity markets remain vulnerable to a short-term pullback any weakness that does develop is expected to be limited in both time and price. Support for the S&P 500 is 2200 to 2235.
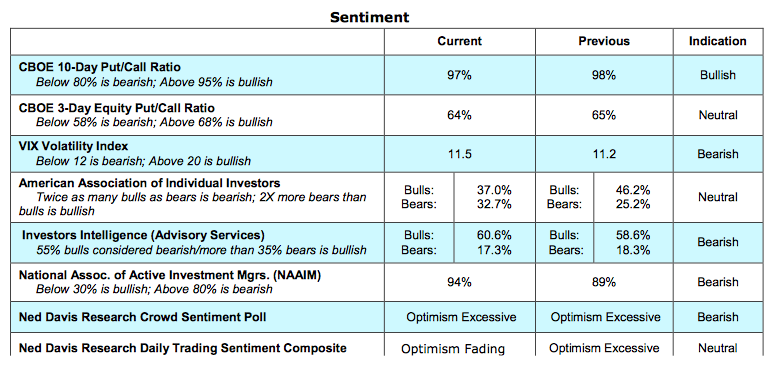
The technical indicators are conflicting offering little insight as to when the current stalemate will end. We suspect, however, that a shift away from the excessive investor optimism seen in the market is likely required before the rally resumes. There is an inverse relationship between investor sentiment and liquidity. When the crowd is overwhelmingly optimistic it often indicates that short-term liquidity has been drawn down making upside progress difficult. As investor optimism fades liquidity is rebuilt and is the fuel for the next rally.
Even though the stock market has experienced virtually no forward progress since mid-December, this has failed to suppress the post-election optimism. Evidence of this is seen in the most recent report from Investors Intelligence (II) that shows the bullish camp of Wall Street letter writers expanding above 60% last week to an 18-month high. The bullish camp is now equivalent to what was seen at near-term peaks in 2014 and 2015. The II numbers show the bearish camp with the fewest number of letter writers expecting a downturn since August 2015 (just prior to a pullback in stock prices). Other measures of investor psychology also indicate an unusually high level of bullishness including the survey from the National Association of Active Investment Managers (NAAIM) that shows an unusually high allocation commitment to stocks. Before the post-election rally restarts we anticipate that investor enthusiasm will move into caution mode.
Thanks for reading.
Twitter: @WillieDelwiche
Any opinions expressed herein are solely those of the author, and do not in any way represent the views or opinions of any other person or entity.

