After just 13 days of trading in 2017, the S&P 500 (INDEXSP:.INX) is up +1.45% on the year and virtually all of those gains were made in just the first two trading sessions of the year.
The other 11 days have resulted in nothing but a sideways consolidation, extending the same behavior we saw at the end of last year.
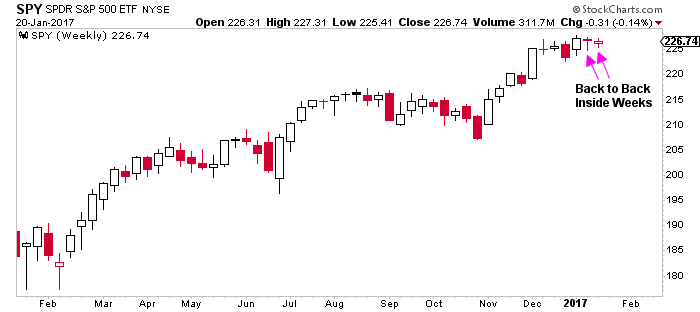
What’s interesting to note about this recent sideways action on the S&P 500 is that ranges have progressively tightened, and we now have back to back inside weekly bars.
Note that an inside week simply means all of prices traded during the week, fell within the range of the prior week. That means, above last weeks lows, and below last weeks highs.
Inside weeks aren’t all that common, and they give us some important context about what future price action may look like. The fact that we have two inside weeks back to back on the S&P 500 makes this pattern even more important to pay attention too.
S&P 500 ETF (SPY) – Weekly Chart
What inside bars tell us is that there is general indecision or complacency in markets and neither the buyers or sellers have the motivation or conviction to drive prices through either price extreme. This type of prolonged sideways trading cannot last forever as ultimately one side of the market will begin to dominate the other which typically gives way to an expansion in volatility, signaled by a sharp move through recent lows or above recent highs.
It’s difficult to know ahead of time, which direction price will ultimately resolve, but by knowing that a directional multi-day or even multi-week move is on the horizon we can prepare ourselves to either mitigate risk or capitalize on upcoming trade opportunity.
Check out more of my work at The Trade Risk. Thanks for reading and good luck out there.
Twitter: @EvanMedeiros
Any opinions expressed herein are solely those of the author, and do not in any way represent the views or opinions of any other person or entity.


