Stock Valuations Drift Higher… How Concerned Should Investors Be?
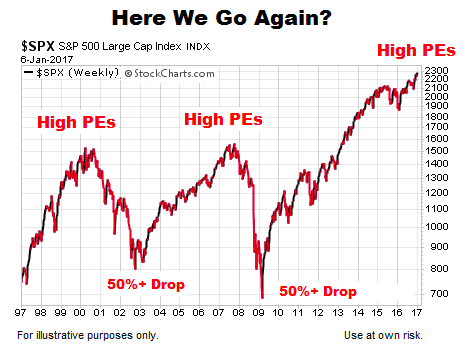
As the markets kick off 2017, there are some common themes making their way from watercooler to watercooler. Two of the most common are: (1) stocks are expensive from a historical perspective and thus risky, and (2) if earnings do not improve substantially over the next few years, the bulls are in big trouble.
These themes were captured in the January 3rd edition of The Wall Street Journal:
Valuations have risen above their long-term average, prompting many analysts to warn that stock gains could be vulnerable without an upswing in corporate profits. “It’s earnings growth that drives stocks over the long term,” said Tom Cassidy, chief investment officer at Univest Corp. of Pennsylvania’s Wealth Management Division. While “we won’t know if any of these policies will actually be implemented” until later in the year, a rise in earnings typically results in additional stock gains, Mr. Cassidy said.
S&P 500 Chart – Here We Go Again?
Are Earnings Really The Primary Driver Of Stock Prices?
It sounds logical and comforting that “earnings drive stock prices”, but is it an accurate and factual expression? If the answer is yes, we would expect the S&P 500 (INDEXSP:.INX) to have a high correlation with earnings. It may be helpful to review what we can learn from correlations. From stockcharts.com:
The Correlation Coefficient is a statistical measure that reflects the correlation between two variables. In other words, this statistic tells us how closely one variable is related to the other. The Correlation Coefficient is positive when both variable move in the same direction, up or down. The Correlation Coefficient is negative when the two variables move in opposite directions. The Correlation Coefficient oscillates between -1 and +1. In general, anything above .50 shows a strong positive correlation.
This Is What A Helpful Correlation Looks Like
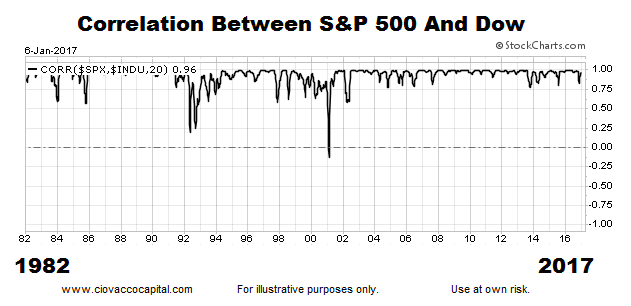
Using a rudimentary example to illustrate what a strong correlation looks like, the graph below shows the correlation between the S&P 500 (NYSEARCA:SPY) and the Dow Jones Industrial Average (NYSEARCA:DIA). We would expect the two major stock indexes to zig and zig together for the most part, which is exactly what the typically-high correlation shows. All things being equal, if we own the S&P 500, we prefer to see a healthy Dow.
This Look Can Be Harmful Rather Than Helpful
Stockcharts.com tells us a high correlation typically produces figures above .50.
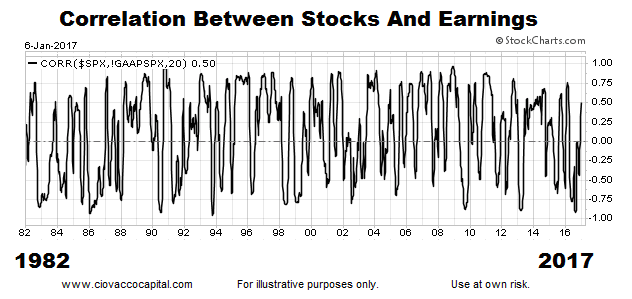
What can we learn from the correlation between stocks and earnings? As shown below, the correlation between stocks and earnings is all over the place and does not appear to be particularly helpful in any meaningful way. In fact, you can make an argument that tracking something that often results in a negative correlation can be more harmful than helpful.
!GAAPSPX is trailing 12-month earnings from the period starting 18 months ago and ending 6 months ago (it is actual reported earnings rather than a highly uncertain forecast of possible future earnings). According to Robert Prechter:
“Earnings don’t drive stock prices. We’ve said it a thousand times and showed the history that proves the point time and again.”
Can Valuations Be Helpful Or Harmful As A Market Timing Tool?
This week’s video takes a 100%-fact-based look at P/E ratios looking back 30 years, examining valuations at major market tops, major bottoms, and within the context of established trends.
You may be surprised what we can learn about the various roles played by valuations, earnings, and investor psychology, and more importantly, how those roles may impact 2017. Do the results back up the watercooler theories that stocks are currently overvalued and highly dependent on strong earnings growth in the coming years? You can decide.
Thanks for reading.
This blog originally appeared over on CCM.
Twitter: @CiovaccoCapital
The author or his clients may hold positions in mentioned securities at the time of publication. Any opinions expressed herein are solely those of the author, and do not in any way represent the views or opinions of any other person or entity.


