Natural Gas Technical Analysis
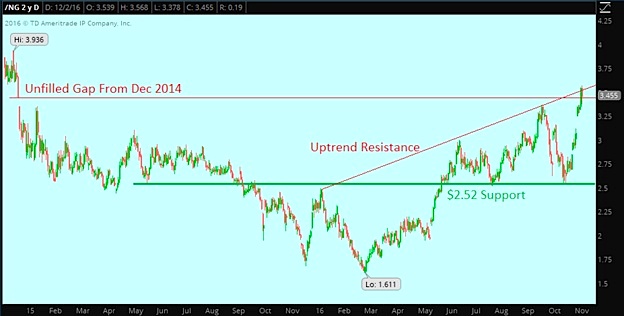
Prompt-month Natural Gas held the $2.52 support level in mid-November then rocketed to fresh 2-year highs above $3.50 last week. The January contract has not surpassed its October highs in the $3.60s, however.
It now finds itself at a point of resistance from two main chart features. One is an old unfilled gap from December 2014. Unfilled gaps are like ‘unfinished business’ on a chart – price likes to eventually fill the gap. In this case, it took nearly 2 years. Another feature on the charts is an upward sloping resistance trend line. If we connect the highs from early 2016 to the summer to the fall, we see resistance near $3.60.
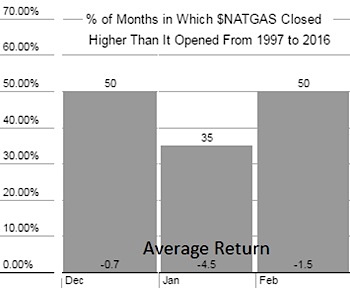
Another bearish risk for NG is seasonality. In the past 10 years, on average, NG tends trade lower now through early March. In the past 20 years according to StockCharts.com, December is higher only 50% of the time with an average return of -0.7%. January is the worst month of the year with an average return of -4.5% and higher only 35% of the time. February is a bit better, but still weak with an average return of -1.5% and higher in 10 of the past 20 years.
Natural Gas Weather Outlook
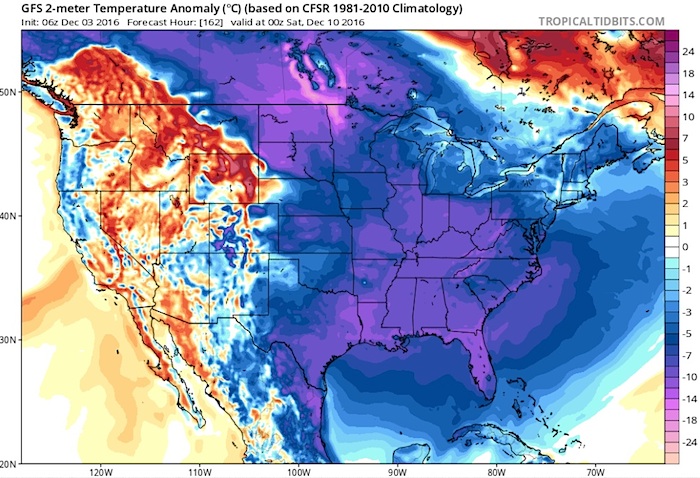
Turning to the weather and demand outlook for natural gas, it appears that cold risks are in store for the next two weeks. Beyond that, the finish to the month of December appears to have more bearish mild temperature risks across the USA. Natural Gas futures and Power traders look to the energy demand centers of the Midwest, Mid-Atlantic, and Northeast. A strong cold front is expected to push into these areas at the end of the week, but these bullish risks are certainly already priced into NG at this point. The below American GFS weather model map for Friday 12/9 has agreement from other models as to the cold risks this week and weekend. The map shows temperature anomalies, or deviations from average temps.
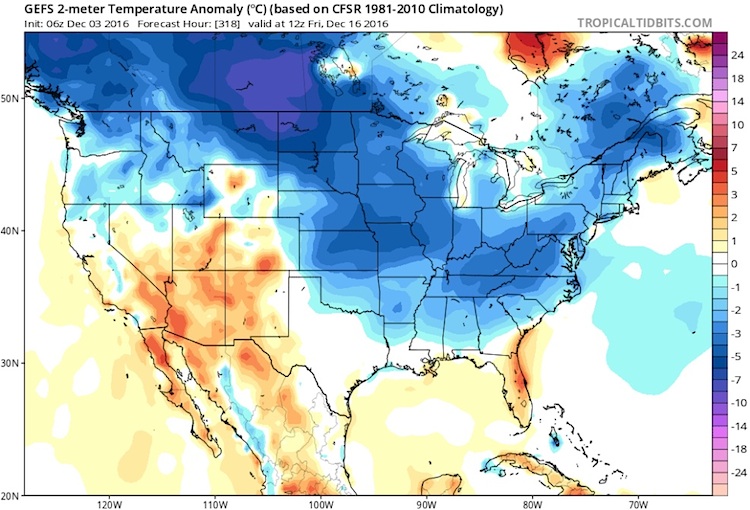
Another front may be on the way 10-12 days out, in time for the following weekend, but confidence is lower on its likelihood and strength, so we could see NG price volatility until we gain confidence for that timeframe. The below GFS Ensemble map shows a bias toward below average temperature risks for much of the country on Friday 12/16. The latter third of the month shows some warmer, more bearish, weather patterns.
Thanks for reading.
Twitter: @MikeZaccardi
Any opinions expressed herein are solely those of the author, and do not in any way represent the views or opinions of any other person or entity.


