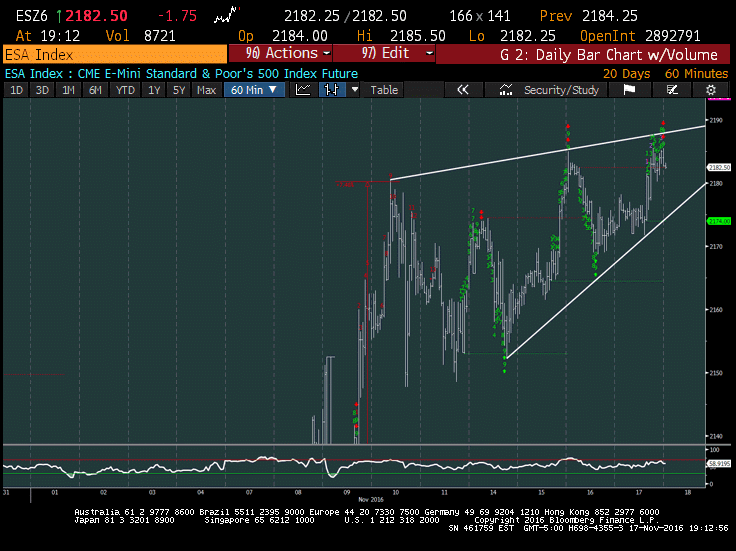
S&P 500 Futures – Chart Insights
The S&P 500 (INDEXSP:.INX) looks to be forming an ending diagonal of sorts on both the cash index and the futures. Note the chart above is futures. This type of pattern forms when higher highs and higher lows create a triangle-like pattern – this has unfolded over the past week. This pattern tends to be bearish in nature and may lead to a Thanksgiving week pullback. That said, it’s just a multi-day (short-term) pattern, so the consequences from this pattern alone may be shorter-term in nature.
Near-term, further upside looks unlikely and could result in a backing off in prices into early next week. I wrote an in-depth post about this earlier today. A move below today’s lows may trigger additional selling.
Provided 2167-8 holds, this could be a short-term non-event (so watch that level). However, a move down under that level would allow for pullbacks to the 2146 area in short order. Overall, traders should exercise selectivity over the next week or two given this pattern.
Thanks for reading.
Twitter: @MarkNewtonCMT
Any opinions expressed herein are solely those of the author, and do not in any way represent the views or opinions of any other person or entity.


