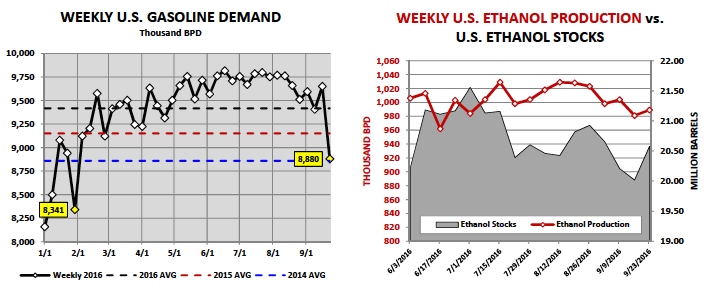
The most notable feature in the corn market mid-week came from the energy complex and the EIA’s weekly Petroleum Status report. The EIA’s figures showed U.S. gasoline demand falling to just 8,880 thousand barrels per day for the week ending August 23rd, 2016. This was down 770,000 barrels from the week prior. It was also the lowest weekly U.S. gasoline demand estimate since January 29th, 2016 (8,341 thousand bpd). This has some implications for the corn market…
How is this important as it relates to the corn market?
Lower U.S. gasoline demand equals less demand for E10 (10% ethanol blends in gasoline), which over time should pressure ethanol prices (and ethanol plant margins). This then would reduce the demand for U.S. corn to produce ethanol. U.S. ethanol production has been on fire for the last several months with production averaging over 1,000 thousand bpd from June 3rd through September 23rd, 2016. As a point of reference, prior to 2016 U.S. ethanol production had only exceeded 1,000 thousand barrels per day on a weekly average on two separate occasions (in November and December 2015). That said despite recent record U.S. ethanol production, U.S. ethanol demand has been nearly as impressive. This is evidenced by U.S. ethanol inventories only increasing 1.7% over that same time period.
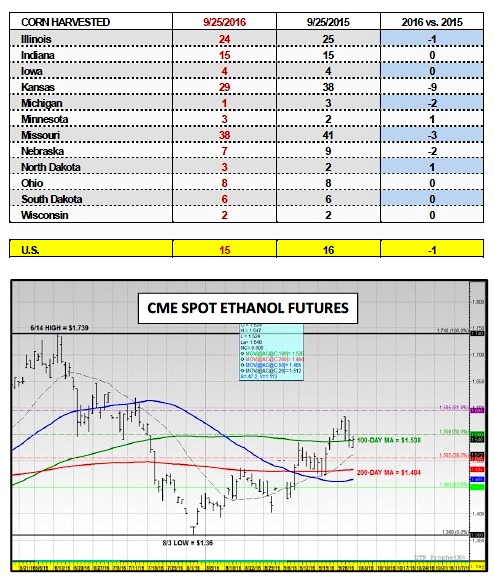
HOWEVER…the primary catalyst driving the need for more and more ethanol (and in doing so preventing major builds in ethanol inventories) has been a strong U.S. gasoline demand market. Therefore this week’s 8% decline in U.S. gasoline demand and subsequent 562,000 barrel increase in U.S. ethanol stocks is potentially cause for concern regarding the demand for U.S. ethanol (E10) going forward. If U.S. gasoline demand doesn’t bounce back over 9,250 to 9,500 thousand bpd in the next couple of weeks I do believe the market will continue to see a rise in U.S. ethanol stocks along with increased pressure on ethanol values. In fact Chicago (Argo) ethanol values already reacted both swiftly and aggressively to the implications of the latest EIA figures closing down approximately 6 ½-cents per gallon combined on Wednesday and Thursday.
Long-term any sustained decrease in U.S. gasoline demand will force U.S. ethanol producers to lower industry run-rates to balance the impact on U.S. ethanol stocks (ethanol exports cannot in my opinion compensate for a material decrease in weekly gasoline demand). Additionally, contraction in the Gross Ethanol Crush Margin should also work to create the necessary market incentive to slow ethanol production. That said with U.S. corn-ethanol demand forecasted at 5,275 million bushels for 2016/17 (36.4% of Total U.S. corn demand), Corn Bulls can ill afford even minor decreases to corn-ethanol use with U.S. corn ending stocks already projected at a 29-year high of 2,384 million bushels.
Please note I don’t believe the possibility of lower corn-ethanol demand will have any immediate impact on corn futures values. One below-average week of U.S. gasoline demand certainly doesn’t establish a trend. However where it will likely come into play is if and when corn rallies back to current levels of nearby resistance ($3.47 to $3.55 CZ6). That’s when decisions concerning the future prospective health of all major corn market demand sectors (feed, ethanol, and exports) dictate whether or not Money Managers find sufficient justification to push corn values another leg higher.
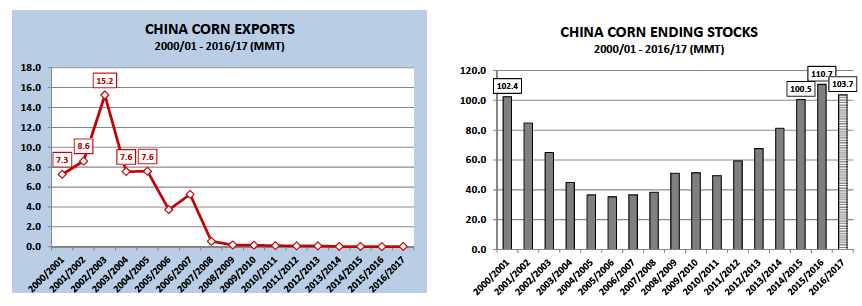
The other story of note that circulated Friday morning was a report issued by Reuters suggesting that China had given approval to at least 2 state-owned companies to export corn (approximately 2 MMT). Why is this significant? China has not been a player of any consequence in the world corn export market since 2006/07 when they exported 5.3 MMT. Conversely China has been a notable IMPORTER of over 3.5 MMT of corn on average over the last 5-years. Therefore this announcement came as somewhat of a surprise; however I wouldn’t call it completely unexpected. In recent years China’s corn ending stocks have exploded to over 100 MMT (2016/17 estimate is 103.7 MMT), levels not seen since 2000/01. Back then China issued a similar policy to drive down domestic stocks by exporting on average 7.9 MMT of corn each crop year from 2000/01 through 2006/07.
What’s the potential impact on the U.S. corn market? Again, similar to my above comments on corn-ethanol demand, I don’t think there will be an immediate Bearish impact given China’s corn prices currently exceeding comparative values from other major export players (U.S., Argentina, Ukraine, and Brazil). However longer-term the U.S. S&D table is counting on a 9-year high in U.S. corn exports for 2016/17 totaling 2,175 million bushels to help offset this year’s record-setting U.S. corn supplies. Furthermore that optimistic export projection has been predicated on reduced Brazilian corn exports allowing for a resurgence in U.S. business. Clearly the last thing the U.S. needs at the moment is even the suggestion of unwanted future export competition from a country like China, who holds a location/freight-spread advantage to several key corn importers in SE Asia. This could prove to be a major fundamental price driver later in the 2016/17 crop year.
December Corn Futures PRICE FORECAST
Key CZ6 Pricing Considerations For The Week Ending 9/30/2016:
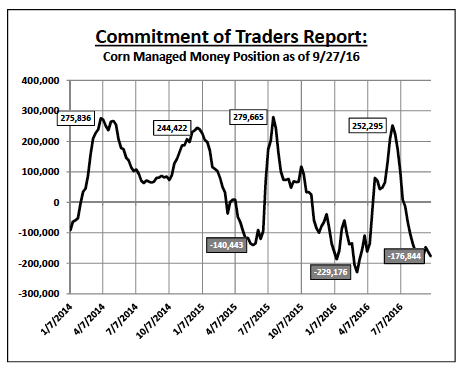
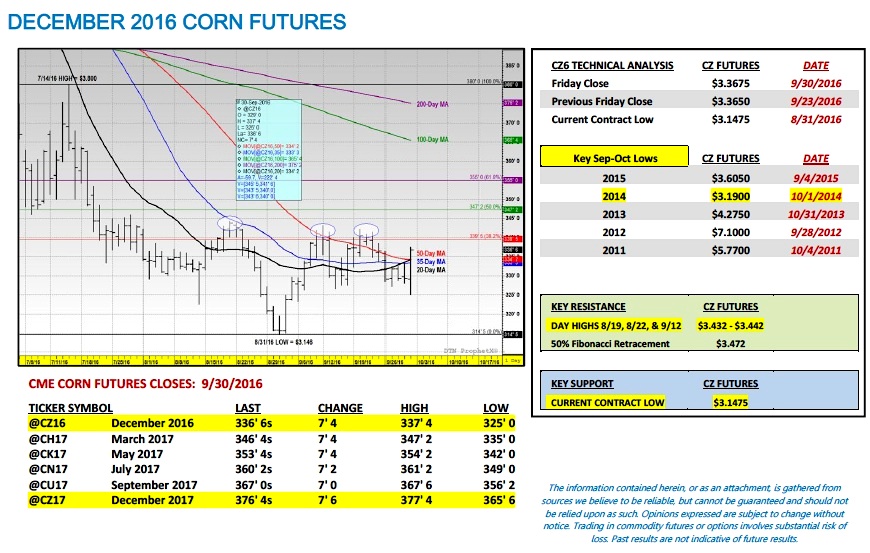
December corn futures enjoyed a 7 ½-cent higher close on Friday, finishing at $3.36 ¾ per bushel. It was a key technical close for Corn Bulls with CZ6 pushing past the 20, 35, and 50-day moving averages, which had consolidated from $3.33 ¼ to $3.34 ¼. The surge in corn futures occurred shortly after the USDA released its September 1 Grain Stocks report. September 1 corn stocks were estimated at 1,738 million bushels versus 1,731 million in 2015 and the average trade guess of 1,754 million. There was nothing “Bullish” about the stocks figure other than it was slightly below the average trade guess. The rally from my point of view remains an extension of price seasonality (higher during the month of October), as well as, continued indications of corn being technically oversold. Friday’s Commitment of Traders report showed the Managed Money net short increasing to -176,844 contracts as of Tuesday’s close. Corn’s ability to trade higher despite the presence of additional Managed Money selling is yet another indication that an upward trend change in CZ6 is looming.
That said how high can December corn futures rally over the short-term? I still wouldn’t overlook opportunities to sell something close to $3.47 ¼ to $3.55 (50% and 61.8% Fibonacci retracements) if CZ6 can build on Friday’s strong close early next week. As of 9/25 only 15% of the U.S. corn crop had been harvested. Therefore traders have to anticipate layers of commercial hedge (sell) paper still to come, which should create a consistent offset to any sustained buying presence from Money Managers looking to liquidate a percentage of their massive net corn short. Additionally, the vast majority of early corn yield results in the Eastern Corn Belt and Illinois in particular have been excellent. Therefore…I still view rallies to key resistance as selling opportunities (next 30-days).
Thanks for reading.
Twitter: @MarcusLudtke
Author hedges corn futures and may have a position at the time of publication. Any opinions expressed herein are solely those of the author, and do not in any way represent the views or opinions of any other person or entity.
Data References:
- USDA United States Department of Ag
- EIA Energy Information Association
- NASS National Agricultural Statistics Service

