August was an uneventful month, as many on Wall Street typically take their summer holiday during this period. Most stock market indexes were little-changed.
Stocks & Bonds
Global stock markets surprised many market pundits by shrugging off Brexit and roaring back in July. European equities outperformed, after underperforming in June. There has been little volatility in currency markets. By the numbers:
Commodities & Currencies
Crude Oil prices bounced back from their July losses, and were up just over 4% year-to-date at the end of August. With global demand still anemic, market participants continue to watch for intervention from OPEC. However, any hopes that OPEC would restrict production and drive prices higher have been dashed by the refusal of the Saudis to abandon their policy of pumping to force weaker producers out of the market. Any change in this policy would also significantly boost the economic fortunes of their nemesis Iran. So, Americans continue to enjoy low(?) prices at the pump. Gold prices declined over 3% in August, but are still up over 23% year-to-date.
The dollar gained nearly an imperceptible amount in August, and is down just under 3% year-to-date.
Economy
The ISM Manufacturing PMI in August came in at a surprising and disappointing 49.4%, marking a decline after almost 6 months of expansion. The non-manufacturing, or services, index also disappointed, albeit with a still-positive reading of 51.4. This marks a slower expansion in August than the July rate of 55.5d SSF %. (For ISM reports, a number above 50 indicates expansion, below 50 indicates contraction). The Commerce Department released its second estimate of second quarter GDP growth, a lackluster 1.1%. This was revised down from the initial estimate of 1.2%. The National Association of Realtors reports that existing-home sales in July 2016 were 1.6% lower than in July 2015. This marks only the second reading of decline in the last 21 months. However, the median price increased 5.3% to $244,100. This marks over 4 years of rising median home prices. To some extent, the rising prices are slowing activity as many would-be homebuyers are priced out of the market. Distressed sales (foreclosures and short-sales) were 5% of the market in July, the lowest share since NAR started tracking this figure in 2008.
Commentary
After the stock market crash of 2008, double-digit returns were the norm for several years. This is not unusual, since the crisis was more of a ‘financial’ crisis than a ‘real’ crisis. After all, the S&P 500 declined 37% in 2008, while the Gross Domestic Product of the U.S. declined by only 0.3%. (the following year was a bit worse, with GDP declining 3.1%). However, the rebound effect could not last forever, and the last few years have seen not only a stall in terms of stock market growth, but marked declined in areas where real growth has disappointed financial expectations.
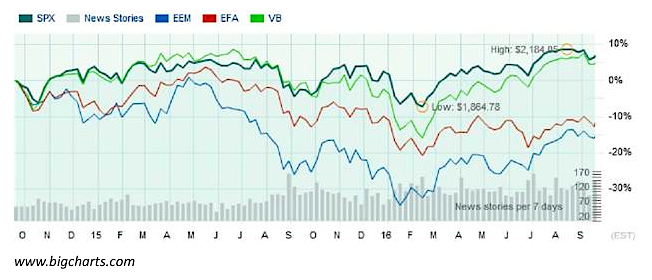
To show the performance of stock markets in emerging countries (such as Brazil, Russia, India & China) I have traced the iShares MSCI Emerging Markets Index ETF (EEM). To show the performance of more developed economies (Europe, Japan, etc.) I have used the iShares MSCI EAFE ETF (EFA). VB represents a small-cap U.S. stock index ETF, and SPX is the S&P 500 index.
The S&P 500 is up only 5% in the last 2 years, but if you have avoided even larger declines elsewhere, you have done some things right. Developed economy stock markets are down over 10%, as measured by the index, and emerging markets are down over 15%. This chart is a perfect example of the old adage ‘when the U.S. sneezes the rest of the world catches cold.’ Massive declines in commodity prices, including oil and iron ore, have an outsized effect on emerging nations. The U.S. economic recovery is one of the weakest in history, but it is even weaker in Europe.
Since I do not have a crystal ball, I tend to think about three possible outcomes going forward – large declines, large gains, or another 2 years of anemic single-digit returns. To hedge against losses, I maintain positions that will guard against losses in a downturn. To participate in any large gains, I prefer equities over bonds, unless a client’s risk tolerance does not allow that. And to protect against anemic growth, I use equity fund managers who have a proven track record of finding investments ‘off-the-beaten-path’ and, in my opinion, have the possibility to achieve larger returns than the S&P 500, even with snail’s-pace GDP growth.
Thanks for reading.
This material was prepared by Greg Naylor, and all views within are expressly his. This information should not be construed as investment, tax or legal advice and may not be relied upon for the purpose of avoiding any Federal tax liability. This is not a solicitation or recommendation to purchase or sell any investment or insurance product or service, and should not be relied upon as such. The S&P500, MSCI EAFE and Barclays Aggregate Bond Index are indexes. It is not possible to invest directly in an index. The information is based on sources believed to be reliable, but its accuracy is not guaranteed.
Investing involves risks and investors may incur a profit or a loss. Past performance is not an indication of future results. There is no guarantee that a diversified portfolio will outperform a non-diversified portfolio in any given market environment. No investment strategy can guarantee a profit or protect against loss in periods of declining values. Listed entities are not affiliated.
Data Sources:
- www.standardandpoors.com – S&P 500 information
- www.msci.com – MSCI EAFE information
- www.barcap.com – Barclays Aggregate Bond information
- www.bloomberg.com – U.S. Dollar & commodities performance
- www.realtor.org – Housing market data
- www.bea.gov – GDP numbers
- www.bls.gov – CPI and unemployment numbers
- www.commerce.gov – Consumer spending data
- www.napm.org – PMI numbers
- www.bigcharts.com – NYMEX crude prices, gold and other commodities
- www.federalreserve.org – historical data on 10-year Treasury note
Any opinions expressed herein are solely those of the author, and do not in any way represent the views or opinions of any other person or entity.


