It’s probably an understatement to say that the Gold Miners Sector (NYSEARCA:GDX) – and gold mining stocks – have been outperformers in 2016. But from a trading standpoint, the recent action in the miners has been concerning.
Commodities are a pretty volatile asset class. And gold isn’t an exception.
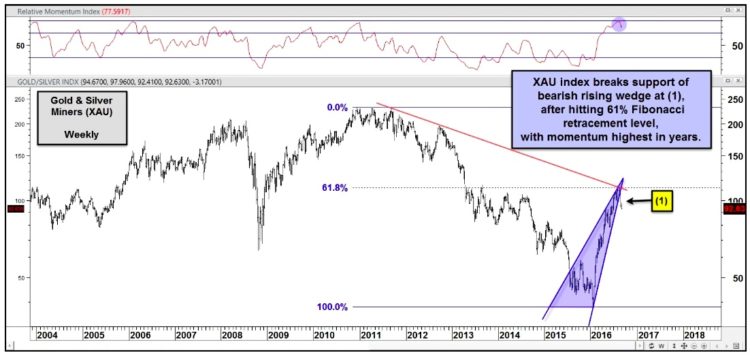
Below is a chart looking at past 10 years for the PHLX Gold & Silver Mining Index (INDEXNASDAQ:XAU). Notice all the big directional price swings/moves. This makes gold mining stocks difficult to buy and hold (and silver mining stocks). Perhaps they’re better left for trading.
XAU is my favorite Gold & Silver Mining Index for 2 reasons. First, it is the oldest mining index in the states. And second, the index includes both Silver and Gold mining stocks.
Gold & Silver Mining Index (XAU) Chart – 10 Years
Chart Insights: XAU has rallied back to the 61.8% Fibonacci retracement level (resistance). At the same time, it’s also running into falling trend line resistance.
That confluence of resistance is pretty strong and should be respected. But there’s more…
More from Chris: Risk On? Watch The Nasdaq 100 & Junk Bonds
XAU is on alert for a potential reversal, as the price action has formed a steep rising wedge pattern. And it’s currently close to falling out of the wedge pattern (bearish). A strong move lower would likely indicate a deeper correction for silver and gold miners. Traders will need to be disciplined when watching/trading this set up, though. Momentum is at its highest level in twenty years. This means that it’s been red hot (which could continue a little longer). BUT it also means that it’s vulnerable to a reversal.
Thanks for reading.
Twitter: @KimbleCharting
The author may have positions in related securities at the time of publication. Any opinions expressed herein are solely those of the author, and do not in any way represent the views or opinions of any other person or entity.


