Junk bonds have done an excellent job at sending risk on/off signals to investors (for the broad stock market indices). Today, I’m providing an update on the Junk Bond ETF (NYSEARCA:JNK) and what it’s saying now. We’ll need to take a look at the price action and chart.
In fact, we’ll look at the past 10 years for good measure.
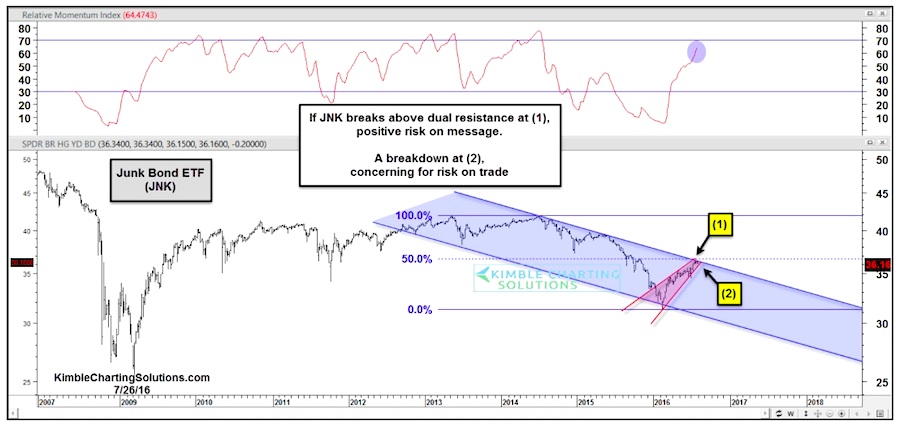
The junk bonds ETF finds itself at an important juncture, as the current rally meets resistance. I believe that what the ETF does over the next two weeks may be a strong indicator of what’s to come in the broader stock market.
After peaking in 2014, JNK saw significant weakness. The S&P 500 Index (INDEXSP:.INX) didn’t move much higher after that peak.
Technically speaking…
Junk bonds finally hit falling channel support in February, right around the time that stocks bottomed. The bounce higher signaled a risk-on trade that would prove stronger than many thought. Now JNK is testing a confluence of resistance (at point 1 below):
- The top of its multi-year falling channel
- Its 50% Fibonacci retracement level
If junk bonds (JNK) can breakout above resistance, the risk-on trade would likely respond with another push higher.
However, if JNK would happen to fall out of its current wedge patter (at point 2), it would signal risk-off.
Note that weekly momentum is nearing the high end of its 10-year range (top of chart above). So what “junk” does here is important.
Thanks for reading and have a great rest of your week.
Read more from Chris: Is The Bull Market In Government Bonds In Trouble?
Twitter: @KimbleCharting
The author does not have a position in related securities at the time of publication. Any opinions expressed herein are solely those of the author, and do not in any way represent the views or opinions of any other person or entity.


