The price action is once again at all time highs for the major stock market indices. So, where do we go from here? Could a stock market pullback be lurking around the corner?
To actually consider that I would or for that matter, anyone would know where this market may be headed is simply a guess at best. This is why I tend to stay away from actually figuring out if we are headed up or down on any given day. Instead, I simply observe the stock market charts that are in front of me. I’ve found that it’s best to be ready for movements both directions intraday regardless of the larger trend in play.
Now this goes without saying that there will be those that speculate that the stock market will go up and those who will have a vision that it’s going down. Someone will get it right. The one who chose the direction in which the market headed will raise their uncanny ability to predict and the other party will simply slither back under a rock until the next opportunity.
So let’s put all the guessing behind us and look at where the major stock market indices are at. I’ll look at the current technical setup and what we can do to be prepared for potential moves in both directions.
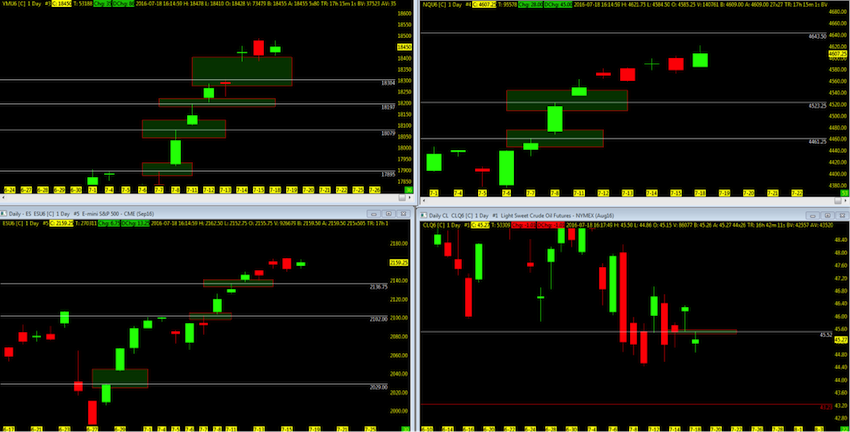
With the market at all time highs once again, it is no doubt that a resistance of price will exist. In the wake of this move up on the post-Brexit vote, I believe traders should take note of the numerous open gaps… they will likely hound the markets in months to come.
The case for more upside in the major stock market indices
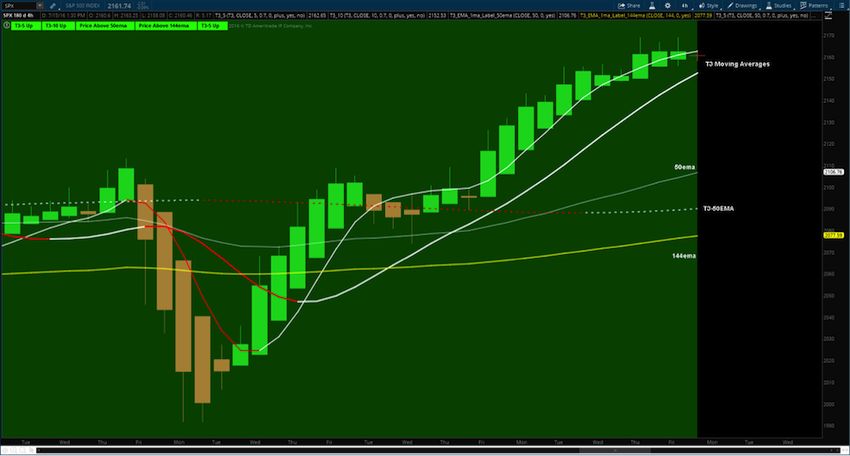
Is it possible that in a election year and with the proposal that the central banks are infusing money into the markets will keep the drive alive? Perhaps. From a technical perspective, price action holding above the key T3-50ema’s and 4 hour/daily and weekly charts all upside are the highest factor for me as a technical trader that the market remains in an uptrend. Fibonacci extension levels and NQ open gaps ahead can just be the catalyst for the S&P 500 (INDEXSP:.INX) or vice versa to continue the drive upside. Also, by the pushing off of any Federal Reserve decision may just hold us up as well. Leaving the bias out of the market means that regardless of your thoughts of why the market should short for more reasons than to keep it upside, is to simply focus on the charts in trend and momentum.
S&P 500 Index Chart (INDEXSP:.INX)
The case for a stock market pullback (i.e. short opportunity)
With as many reasons for the market to push the highs, it also comes with the possibility for a pullback to at least the 50/144ema on the 4 hour charts or daily 50ma’s. Q2 earnings season may be the catalyst for the market to short if the numbers don’t show as expected.
From a technical perspective, the open gaps left in the trace of the post Brexit vote to the upside, are the highest probability that price action turns downside but only until the 4 hour charts T3 moving averages on a 10 tick range chart turn downtrend.
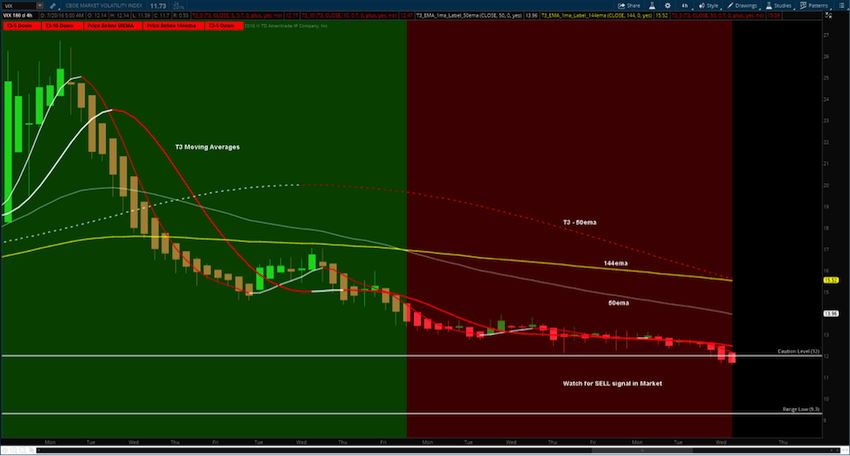
With the VIX Volatility Index at the lows of under 12 now, may be just what the market needs to start to indicate momentum on the SPX to slow down and reverse.
Keep it simple Jedi traders.
While it is my perspective that the market will likely see a stock market pullback, it is best to leave your bias at the door when trading. Simply watch the charts in front of you for the highest probability of price action in trend.
Thanks for reading.
Twitter: @TradingFibz
The author trades futures intraday and may have a position in the mentioned securities at the time of publication. Any opinions expressed herein are solely those of the author, and do not in any way represent the views or opinions of any other person or entity.


