In January of 2016, I wrote an article on Crude Oil Futures where I identified a resistance zone of 37.28 to 41.47 using my Fibonacci method, which I refer to as the “One Shot, One Kill” method.
Note that I was able to identify this resistance zone after my projected target of $27.01 had been hit and the price of crude oil had begun to enter into a relief rally.
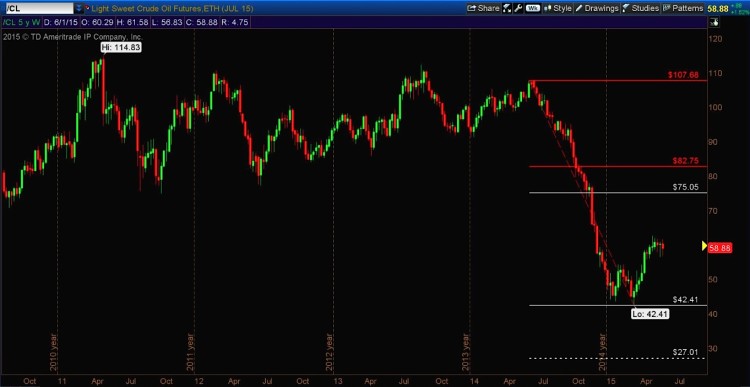
The chart below shows that while crude oil futures were trading at 58.88 (in June of 2015) there was a lower outstanding Fibonacci price target of 27.01. (this chart and target can be found in the link above)
Crude Oil Futures – 5 Year Weekly Chart
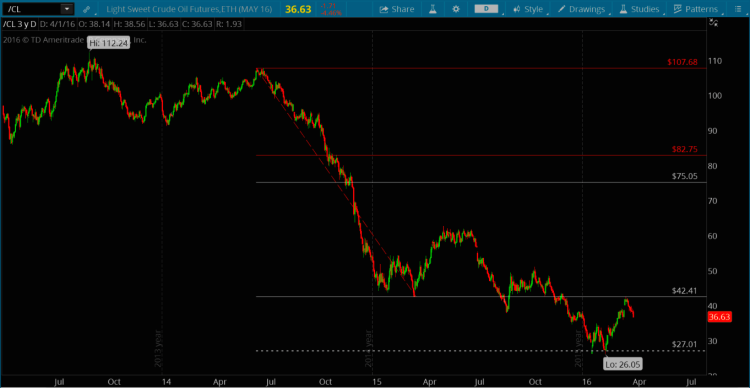
The 3-year chart below shows the target being hit in Q1 16.
Crude Oil Futures – 3 Year Daily Chart
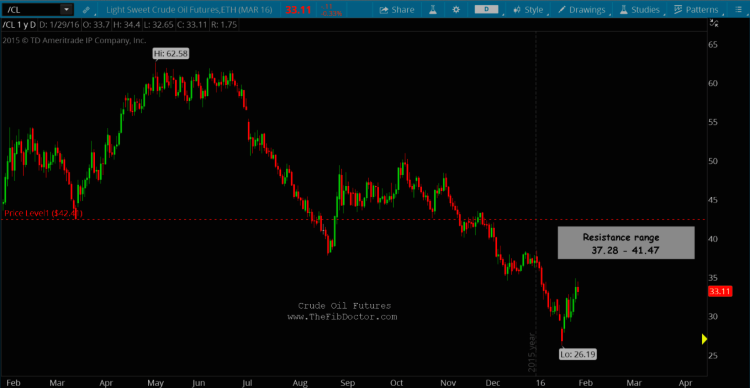
Now let’s take a closer look at the aforementioned resistance zone for oil prices and how I determined where that resistance would be.
My “One-shot, One-kill” method of identifying targets, support and resistance is a method I spent years developing and have found to be amazingly accurate when used correctly. In the chart below, you’ll see the resistance zone highlighted as well as a level marked at $42.41.
Crude Oil Futures – 1 Year Daily Chart
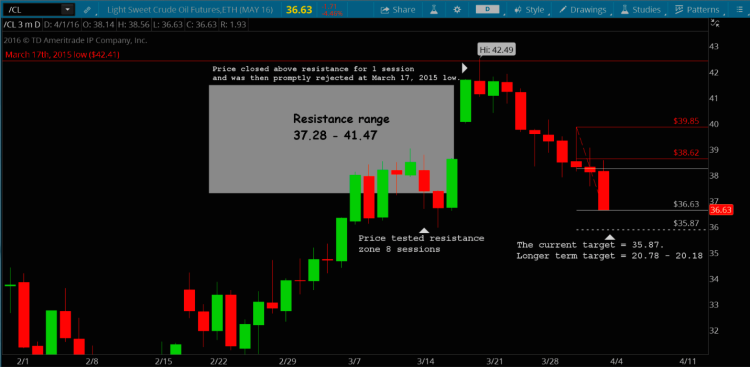
And finally, let’s zoom in on that price target and range to see how it played out.
Crude Oil Futures – 2 Months Daily Chart (see notes on chart)
If you’re interested in learning more about my “One shot, One Kill method,” you can email me at dave@thefibdoctor.com. Thanks for reading and remember to always use a stop!
Twitter: @TheFibDoctor
No position in any of the mentioned securities at the time of publication. Any opinions expressed herein are solely those of the author, and do not in any way represent the views or opinions of any other person or entity.


