It was hard to be confident in the global economy when crude oil prices were crashing in early 2016. The black gold still isn’t out of the woods, but it’s latest 40+ percent rally has made investors feel a bit better about the world… and stocks.
Early this year, it seems that Crude oil is acting as a barometer for the market… crude up, stocks up. Crude down, stocks down.
That’s a rarity, but it’s likely become a bit more correlated due to investor confidence. Let’s just say that $35 or $40 crude oil feels better than $25 crude oil when thinking about global economic health and deflation.
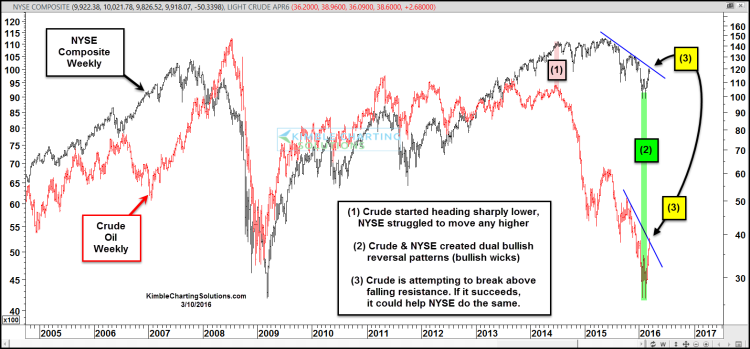
Well, the latest rally in crude oil prices has coincided with a rally in stocks. The NYSE Composite has rocketed off its lows, mirroring the rip higher in Crude oil. And now both are testing a very important resistance level at the same time.
Looking at the chart below, here are the points of interest:
Point (1) – Crude Oil prices started heading sharply lower. This coincided with NYSE Composite Index struggles.
Point (2) – Crude Oil and NYSE Composite created dual bullish reversal patterns.
Point (3) – AND NOW they are both testing falling resistance. If Crude Oil breaks out higher, it could help lift stocks and the NYSE Composite, in my opinion.
Thanks for reading and have a great week.
Read more from Chris: “Chart Of The Week: S&P 500 Testing Key Fibonacci Level“
Twitter: @KimbleCharting
The author does not have a position in mentioned securities at the time of publication. Any opinions expressed herein are solely those of the author, and do not in any way represent the views or opinions of any other person or entity.


