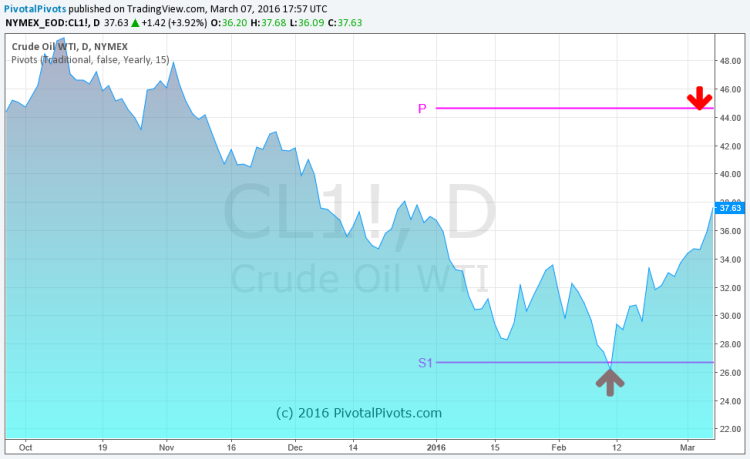
WTI Crude Oil has now rallied around 40% since bouncing off the 1st Yearly Support Pivot Point last month. If you missed it, I highlighted some key yearly support and resistance pivots just last week.
By all accounts, Crude Oil looks like its headed higher yet… But it also appears due for a pit stop.
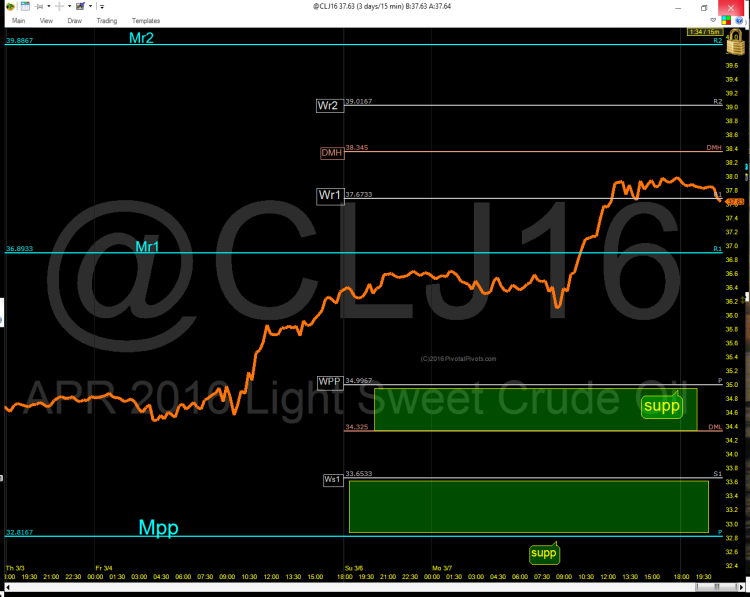
So what would potentially limit Crude Oil’s upside over the near-term? There is a confluence of R1 pivots (Monthly & Weekly) up to $37.67 that could slow the Crude Oil rally this week. Note that at the time of this publication, crude oil prices are toying with this extended level already (having broken it briefly today and resting now around $37.70).
So let’s look at some higher levels yet. If this pivot area gives way with force to the upside, then the next level higher to watch will be the weekly DMH pivot at $38.43. Then comes the weekly (WR2) pivot at $39.01 and Monthly (MR2) pivot at $40. Watch my twitter feed for active updates beyond that.
We’ll likely then see some consolidation in the form of a pullback. When that takes shape, traders should keep an eye on the weekly and monthly support pivots. The weekly pivot resides at $35 while the monthly is at $33.
Crude Oil Chart w/ Pivots
I still feel that the low for the year is in and that the crude oil rally will continue up to the Yearly(P) pivot target at $45, perhaps by late spring or early summer. A better shorting opportunity should develop at that time. Until then, buy the dips on on the support pivots.
Thanks for reading and have a great week.
Twitter: @Pivotal_Pivots
The author does not have a position in the mentioned securities at the time of publication. Any opinions expressed herein are solely those of the author, and do not in any way represent the views or opinions of any other person or entity.


