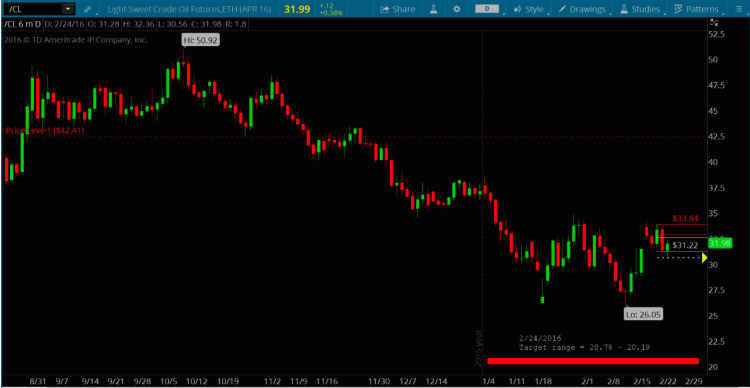
The Crude oil market has garnered a lot of interest over the last year. Much of it has to do with its steep and historic decline, while some has to do with traders infatuated with picking bottoms.
Either way, Crude has been stuck between $26 and $35. And I think it’s time to take another look at Crude Oil.
As outlined in this piece from June 2015, a projected target of $27.01 was hit in January, 2016. A relief rally ensued, helped out by rumors of a cut and/or production freeze by OPEC. As the rumor mill ground to a halt, so did the upward move in prices and crude made another low of 26.05 in February, 2016.
Cue part 2 and more rumors of a freeze in crude oil production levels kicked off yet another rally. Now I feel like price has moved enough in both directions to obtain a new target zone using my Fibonacci levels method.
Recently I identified a resistance zone of 37.28 – 41.47 as outlined in this post.
My new downside target zone for crude oil price is now a very tight zone of 20.78 – 20.18 as shown in the chart below.
Crude Oil Futures – 6 Month, Daily Chart
Thanks for reading and always use a stop!
Further reading from Dave: “S&P 500 Fibonacci Levels To Watch“
Twitter: @TheFibDoctor
No position in any of the mentioned securities at the time of publication. Any opinions expressed herein are solely those of the author, and do not in any way represent the views or opinions of any other person or entity.


