Stock market futures continue to expand into higher resistance for yet another day. Crude oil futures are also pushing higher, giving futures traders a bit more confidence today.
We sit just below a key resistance level on S&P 500 futures at 1907. Lots of congestion sits near 1887-1889. Recapturing and breaching 1907 will bring sellers initially as the chart expands above the level but if the pullback holds (retest), stock market futures buyers may send us to 1912, 1916 and possibly 1924.
If not, we’ll give begin to give back this expansion and move into 1892, 1887.25, 1882.5 and perhaps even 1872.5.
The Morning Report: Stock Market Futures Expand Sharply Into Resistance
Intraday resistance sits near 1907. Intraday support sits at 1880. Momentum on the four hour is positive, but divergent and drifting into support. Our hyper-extension from moving averages on longer time frames have continued to allow for these big bounces in stock market futures. If buyers stand firm, it is possible that we expand further into 1934.75 on S&P 500 futures.
Shorter time frame momentum indicators are sitting in positive territory and trending upward. Longer cycles are flattening in negative territory. Positive divergence is taking hold in longer time frames.
See today’s economic calendar with a rundown of releases.
THE RANGE OF TUESDAY’S MOTION
Crude Oil Futures (CL_F)
The move in crude oil futures did not hold, but the chart has moved into higher support so the form that assuming some larger basing formation is afoot holds steady.
Today, the trading ranges for crude oil futures are between 30.26 and 28.68.
Moving averages in oil are mixed across longer intraday time frames across the board. Noisy trading patterns suggesting support to resistance and resistance to support. Hourly time frames show positive sloping moving averages with positive divergence underneath, suggesting tests of higher resistance ahead.
Intraday long trading setups on crude oil futures suggest a long off 30.26 retest or 29.54 (with momentum showing positive, else that brings a lower high) into 30.67, 30.95, 31.4, 31.73, and if we get squeezed here, we’ll see 32.7 on the bounce event.
Intraday short trade setup suggests a short below a 29.5 failed retest or a failed retest of 30.21 with negative divergence showing sends us to 29.04, 28.68 and 28.35.
Have a look at the fib levels marked in the blog for more targets.
E-mini S&P 500 Futures (ES_F)
Below is a S&P 500 futures chart with price support and resistance trading levels for today. Click to enlarge.
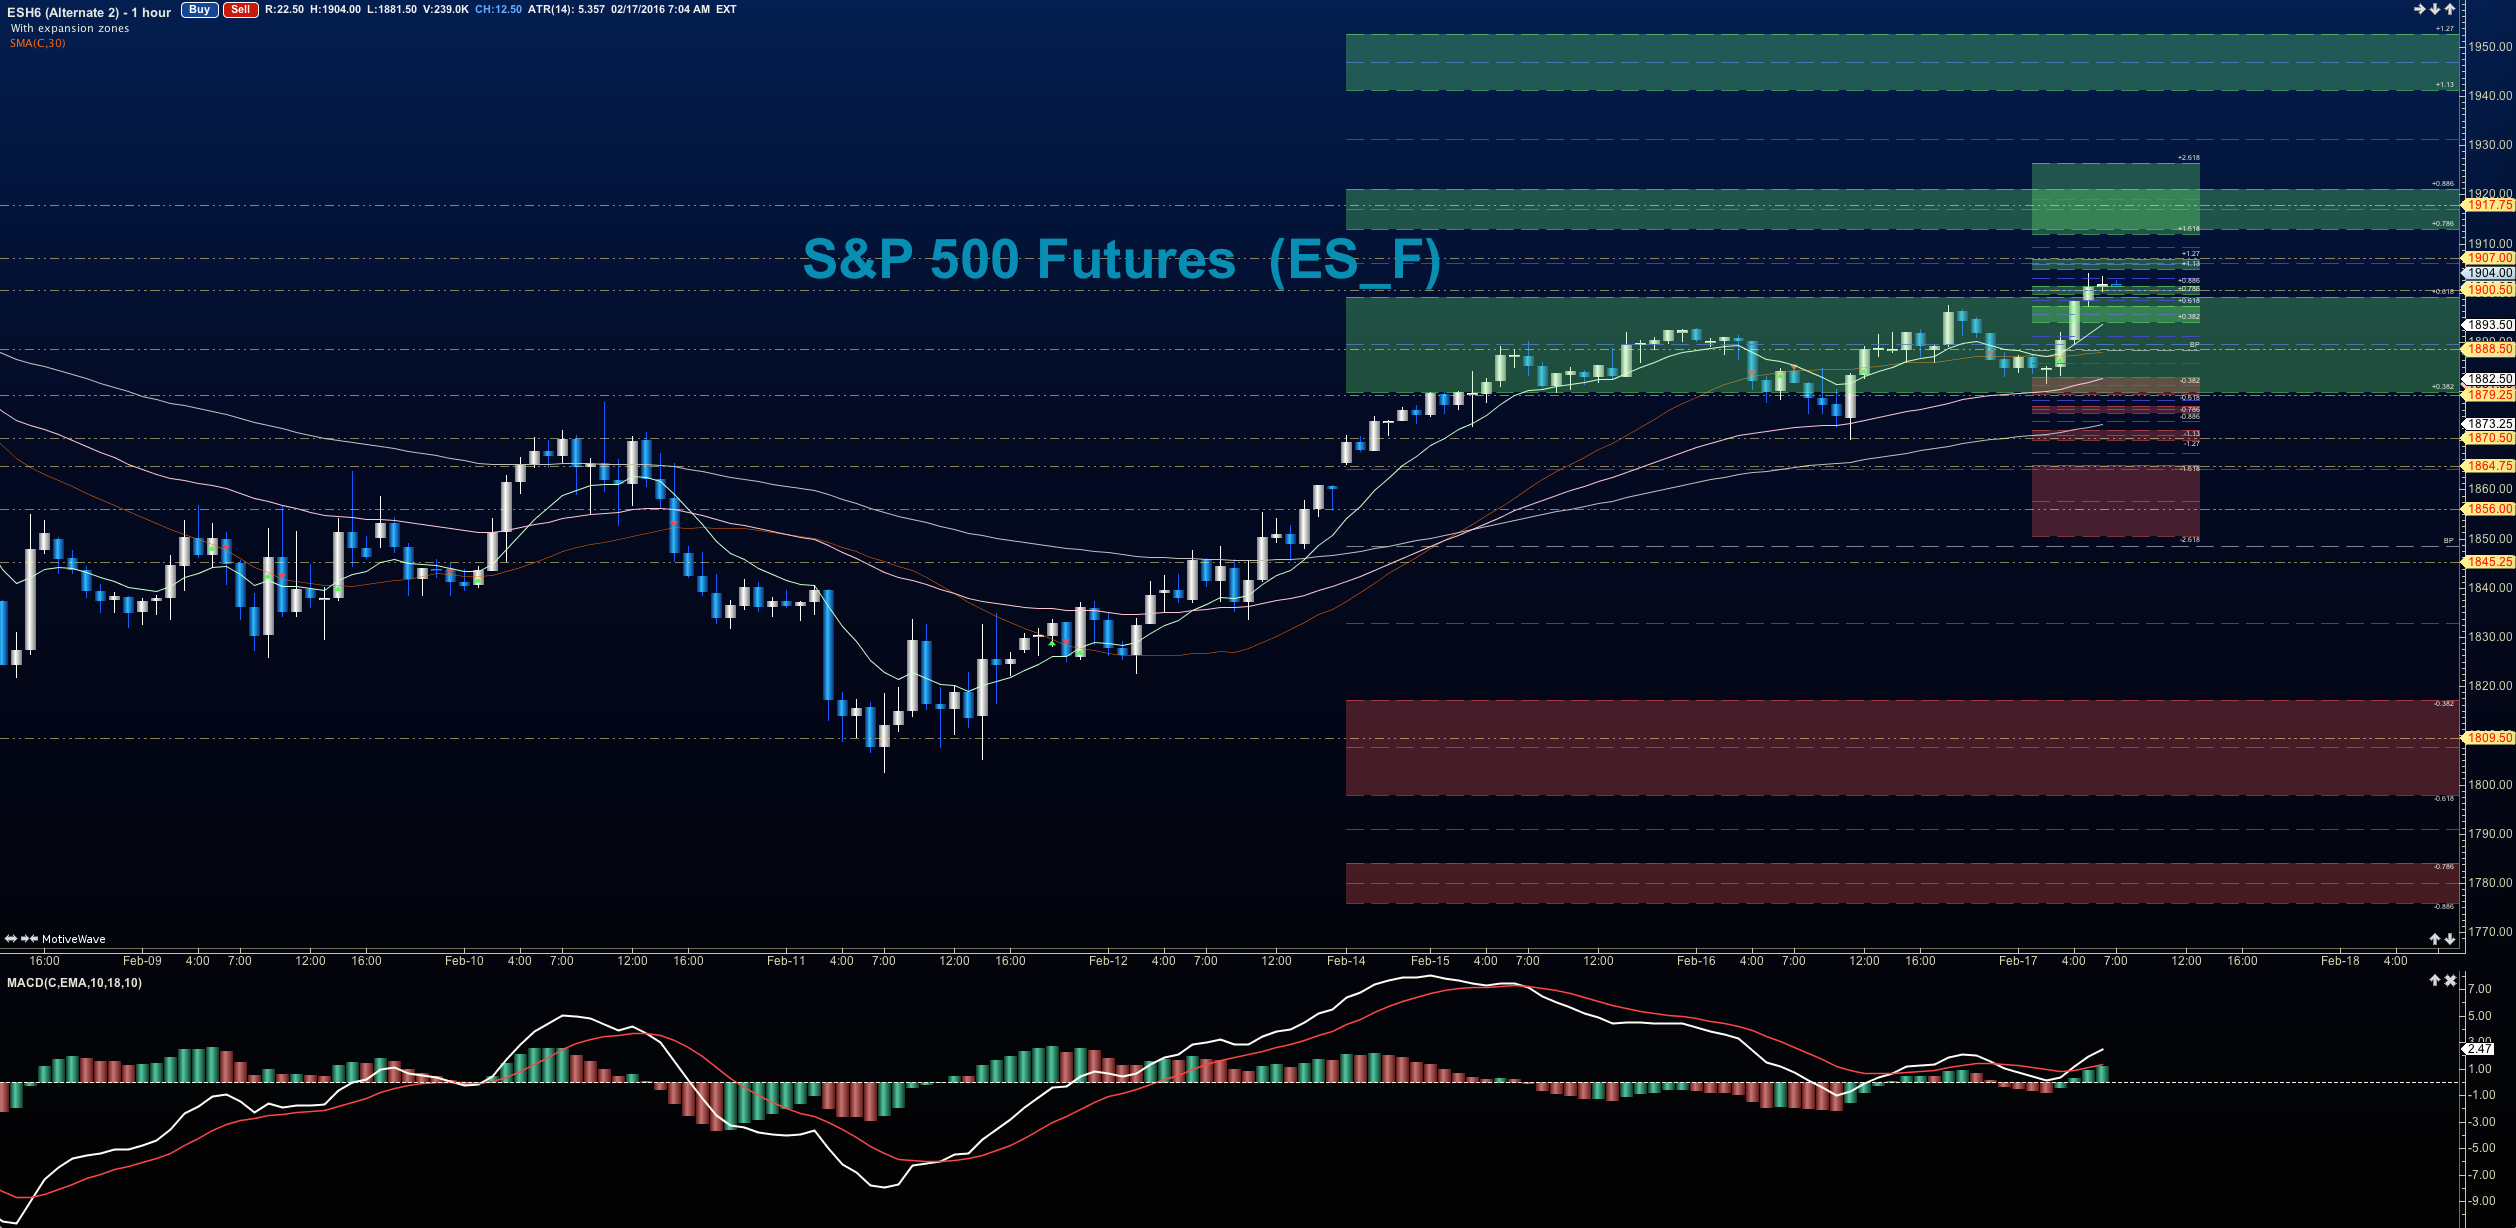
S&P 500 futures have established new support – 1880-1884. Resistance lies ahead so a pullback into higher support is likely.
Upside motion has the best setup on the positive retest of 1892 (watch momentum here) – or a retest after expansion above 1905. Targets from 1905 are 1907, 1911.25, 1914.5, 1917.5 and if we can catch a bid there, we could expand into 1924 and bigger levels have us looking at 1934. Big resistance test sits at the region between 1934-1939. Watch the higher lows to keep you on the right side of the long trade.
Downside motion on the S&P 500 futures opens up on a failed retest of 1897 or at the failed retest of 1907 with negative divergence. Retracement into lower levels from 1897 gives us the targets at 1894.75, 1892, 1888.5, 1885.5, 1879.75, 1873.5 and perhaps 1870.5. If buyers do not provide support there, we’ll see the familiar 1850 level once more.
Have a look at the fib levels marked in the blog for more price targets.
If you’re interested in the live trading room, it is now primarily stock market futures content, though we do track heavily traded stocks and their likely daily trajectories as well – we begin at 9am with a morning report and likely chart movements along with trade setups for the day.
As long as traders remain aware of support and resistance levels, risk can be very adequately managed to play in either direction as bottom picking remains a behavior pattern that is developing with value buyers and speculative traders.
Twitter: @AnneMarieTrades
The author trades stock market futures every day and may have a position in mentioned securities at the time of publication. Any opinions expressed herein are solely those of the author, and do not in any way represent the views or opinions of any other person or entity.
: Creating Bullish Divergence?")


 and Semiconductors (SMH): Concerning Price Pattern?")


