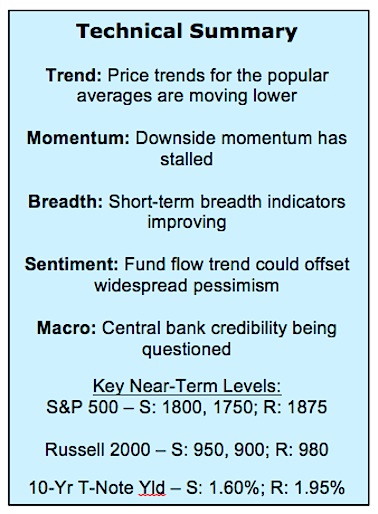
Here’s a look at some key stock market indicators, charts, and themes that we are watching.
This Week’s Stock Market Outlook:
Sentiment Conundrum Puzzling – Investor pessimism has reached levels that have typically supported at least a near-term turn higher in stocks. Instead, the popular averages are testing the lows seen a month ago. It may be that what signaled excessive pessimism in the recent past is simply not enough given the other forces at work in the market (deteriorating trends, poor market breadth and perhaps an asset allocation shift at the household level).
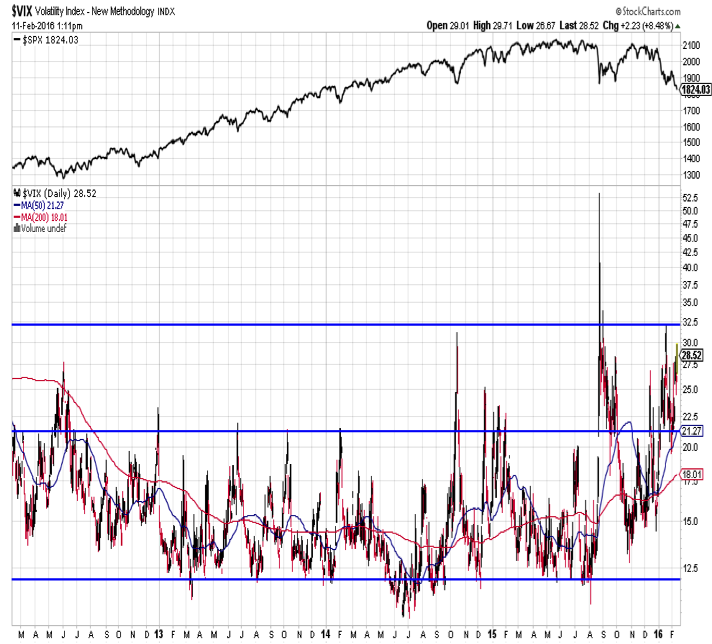
Looking for Signs of Capitulation . . . – To gain confidence that a meaningful (if not final) low is in place we are looking for evidence of stock market capitulation on top of the investor pessimism expressed in the sentiment surveys. A reading on the VIX above 40 and a surge in the TRIN would be strong evidence that investors are throwing in the towel.
. . .to Be Confirmed By a Breadth Thrust – In the wake of such capitulation, we would expect to see widespread buying, marked by at least two days on which we see upside volume outpace downside volume by 10-to-1 (or more), without an intervening 10-to-1 down volume day.
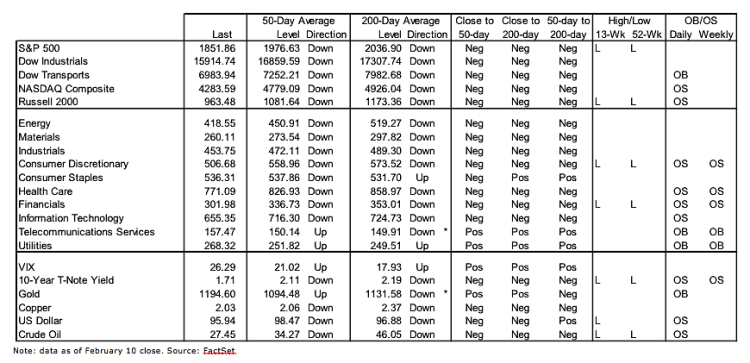
Stock Market Indicators – Indices & Sectors (click to enlarge)
S&P 500 Index
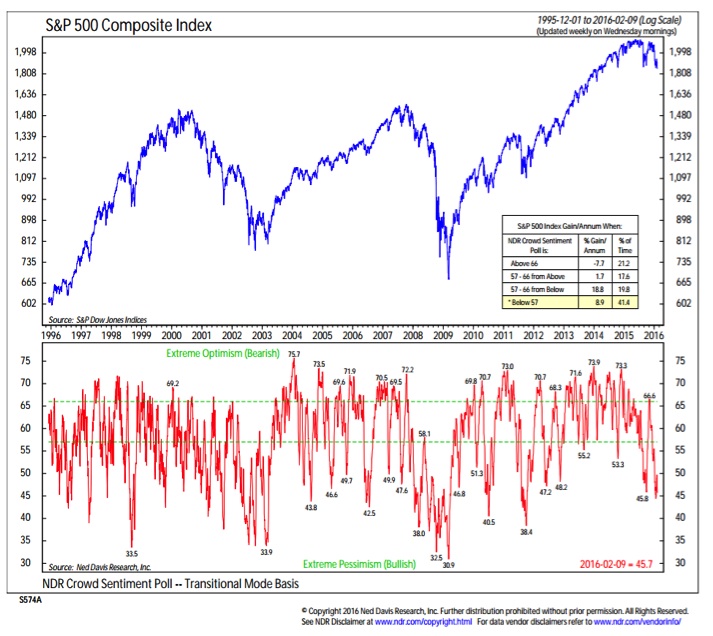
We are seeing evidence of widespread investor pessimism – equity funds continue to see outflows, the AAII survey shows less than 20% bulls and nearly 50% bears, and the bull-bear spread on the Investors Intelligence survey is at its lowest level since 2009. So far at least, this pessimism has failed spark a sustained rally in stocks. While at an extreme reading based on the past few years, the NDR Crowd Sentiment Poll shows that pessimism is not yet at a historical extreme. In other words, we may need to see a further build in investor pessimism before a significant low in stocks is seen.
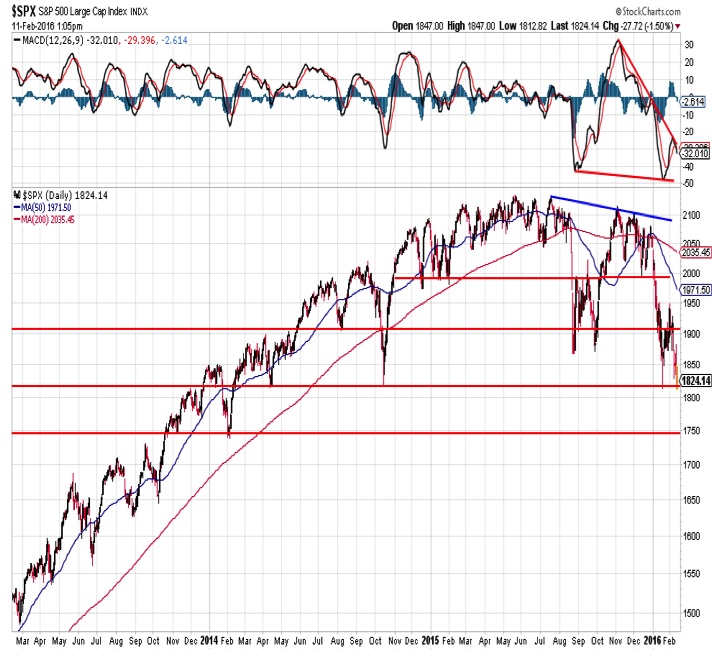
Another way to view the sentiment data is that maybe we did get a bounce (from 1812 to 1950 on the S&P 500) that the excessive investor pessimism suggested was possible. But with the longer-term trends turning lower and too many investors still trying to call a bottom (the NAAIM exposure index rose this week as active managers put money back to work in stocks) the rally fizzled before it really got started. We are now seeing a re-test of the mid-January stock market lows, and if they do not hold, the early 2014 low near 1750 (on the S&P 500) could quickly come into play.
Russell 2000 Index
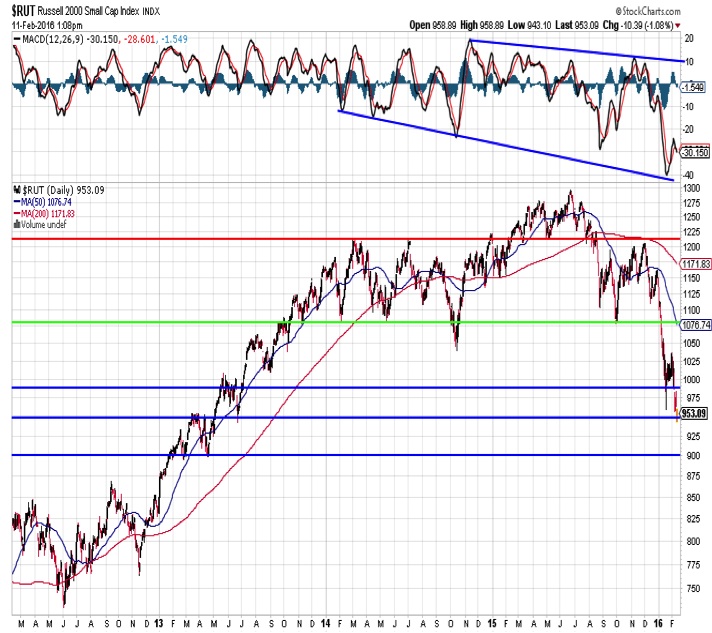
The Russell 2000 has already under-cut its January intra-day lows. As with most downtrends, rallies have been cut short and weakness has gone further than many expect. As with the S&P 500, the Russell 2000 is oversold and a counter-trend rally back to the 50-day or even 200-day average would not be out of the question if we can get evidence that a meaningful low (that is, fear and capitulation followed by upside breadth thrusts) is in place. For now, that is lacking and caution remains warranted.
VIX Volatility Index
While investors have claimed bearishness in sentiment surveys, the VIX Volatility Index has not reflected a meaningful level of fear. When selling emerged last summer, the VIX nearly tripled, rising from 20 to above 50 in relatively short order. We may not need to see a move in volatility of that intensity again, but we would expect to see a rise above the January high.
continue reading on the next page…

