Trading in the equity markets has become increasingly more difficult since last summer, ending a series of buying opportunities with deeper corrections in the stock market and more volatility for stocks.
While the easy money has been made in the latest bull market, there still remains opportunity for investors on the long side and on the short side for those more adept to managing risk on bearish positions.
Below I look at two potential stock trade ideas that I am considering over the near-term (1 bullish and 1 bearish). And like I said, the key with any trade plan is managing risk and understanding when/where to get out.
The two trade ideas are Caterpillar (CAT) and Cincinnati Financial (CINF). Let’s start with CAT.
Caterpillar Stock Chart – $CAT
On January 28th, the $38B construction and mining equipment manufacturer topped Q4 EPS estimates by $0.05. However, digging a little deeper we can see the $11B in quarterly sales was about $400M less than what Wall Street was anticipating (-22.6% on a year over year basis). A bear market in commodities will continue to weigh on Caterpillar in the foreseeable future. Until crude oil, corn, and soybeans rebound don’t expect the multi-year downtrend to end in the stock.
CAT trades at a P/E ratio of 17.14x (2016 estimates), price to sales ratio of 0.80x, and a price to book ratio of 2.54x. Analysts see earnings of $3.70-$3.75 per share for 2016 and 2017, but looking at next year this is a $0.30+ downward revision in last 30 days (echoing concerns of the collapse in major commodity prices).
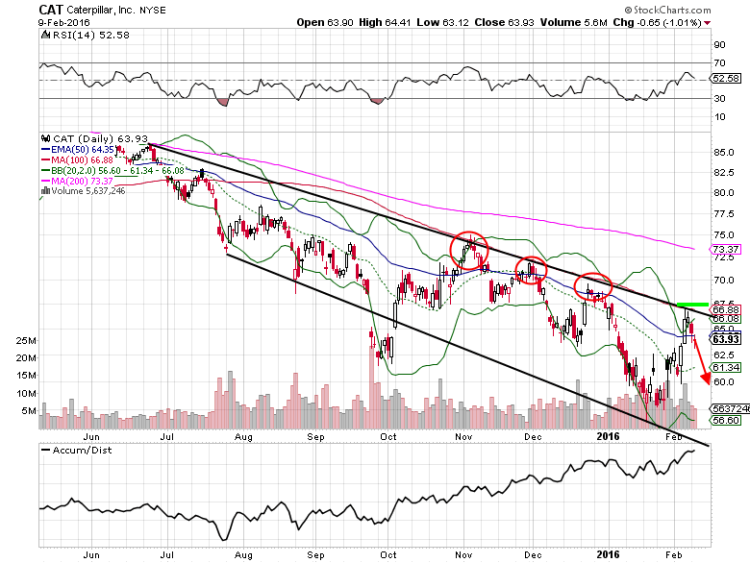
Over the last several months shares of CAT have given traders some excellent shorting opportunities on rallies back up to the 100-day simple moving average (and the top of the downtrending channel). For those looking at a bearish position, a buy stop loss can be placed just above the $67 resistance level. Look for downside pressure to $60 and possibly back towards the mid-$50’s in the next 1-2 months.
Caterpillar Options Trade Ideas
I’m looking at buying the Mar 18 $57.50/$62.50 bear put spread for a $1.50 debit or better.
That would include buying the Mar 18 $62.50 put and selling the Mar 18 $57.50 put, all in one trade.
Stop loss- None
1st upside target- $3.00
2nd upside target- $4.50
Now let’s look at Cincinnati Financial (CINF).
Earlier this month, Cincinnati Financial posted flat revenue growth for the fourth quarter compared to 2014, but trounced earnings estimates by $0.23 ($1.10 vs $0.87). The $10B property and casualty insurer was able to achieve record results for the third consecutive quarter in large part due to a decline in the combined ratio by 450 basis points to 91.1% (lower loss, expense ratio compared to premium dollars taken in for the quarter).
CINF trades at a P/E ratio of 20.97x (2016 estimates), price to sales ratio of 1.94x, and a price to book ratio of 1.55x. On a valuation basis the stock isn’t exactly cheap, but the company has been performing better compared to it’s competitors. They are maintaining a strong balance sheet, 3%+ dividend yield, and have consistently beat bottom line estimates several years.
Let’s look at the stock chart.
Cincinnati Financial Stock Chart – $CINF
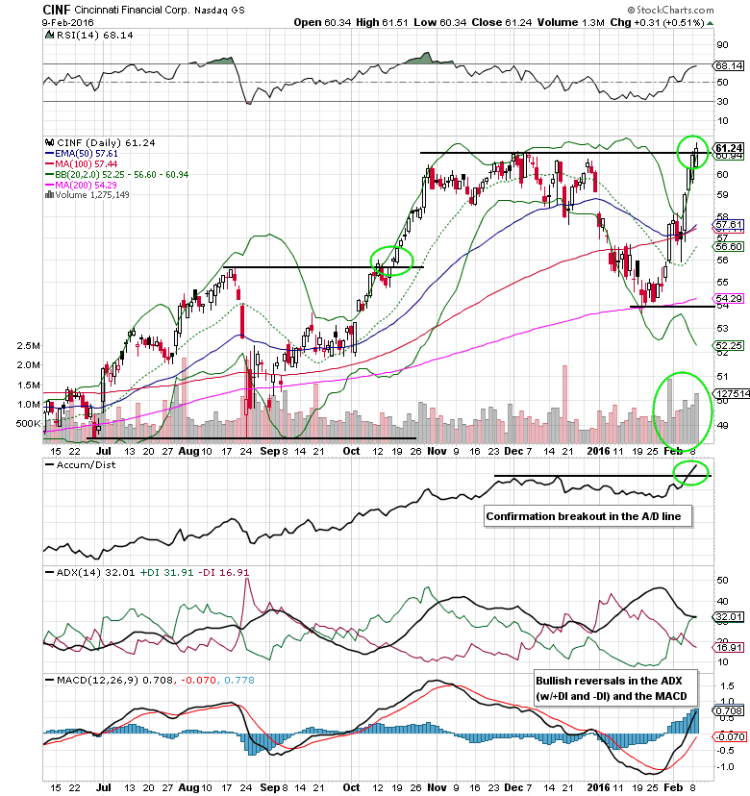
With the average stock down 9-10% year to date, you wouldn’t expect many financials to be positive for 2016 and breaking to new highs, but that is exactly what Cincinnati Financial is doing on the 8-month daily chart above. Similar to the bullish price action in October, shares are resolving to the upside from a $7 trading range (on heavy volume too). Now might be a good time to consider starting or adding to a position. On a measured move basis, the stock could hit $68+ later this year ($61-$54=$7+$61=$68).
Thank for reading.
Further reading from Mitchell: “Progressive Insurance (PGR) Bullish Setup After Q4 Earnings“
Twitter: @MitchellKWarren
The author holds a position in mentioned securities at the time of publication. Any opinions expressed herein are solely those of the author, and do not in any way represent the views or opinions of any other person or entity.


