 By Andrew Nyquist
“Man this investment is painful” and “NatGas is feeling like paper cuts today” are two quotes from recent conversations I’ve had with a friend and investor who happens to have a position in Natural Gas futures and its related index fund (ticker: UNG). My response to his concerns was to ensure his position was “right-sized” and that he look at it as a longer term investment. And although I think I gave him prudent “made-to-order” advice, I found my myself thinking about the charts and the corresponding technical indicators. I knew Natural Gas had been in a horrid bear market, but with all the “yelping,” the contrarian in me said Natural Gas needed a closer look.
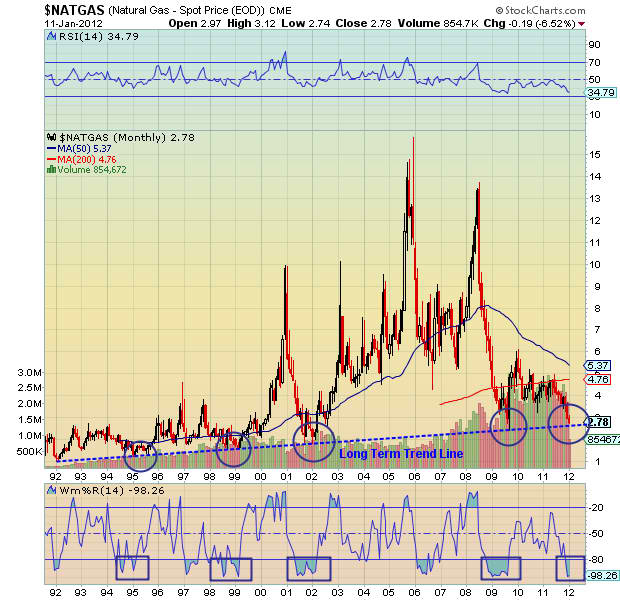
Well, here’s the breakdown: During the early-mid 1990’s, Natural Gas spot price was moving in fits and starts… base-building, per se. But then came the blow-off boom of the mid to late 90’s. And with the benefit of hindsight, who are we kidding, the magnetic pull higher from the mind-trip exuberance far outweighed any early technical developments. Natural gas rose from a little over a dollar in the 1990’s to 15 dollars in late 2005. And, as we are all aware, bubbles have a knack for popping… and the “pop” usually doesn’t end well. Since those bullish days of 2005 it’s been all downhill.
Natural gas closed at $2.78 on Wednesday, it’s lowest close in 2 1/2 years. And, before that, you’d have to go back 10 years to find a lower close. Fortunately (or unfortunately) for my friend, he got in at the equivilent spot price of 3 to 4 bucks… but this doesn’t make the drop any easier to swallow. At current prices, every 2 to 3 cents is a percent, and the losses can add up fast in futures or related funds. Furthermore, this is precisely why both short and long term investors should be patient and wait for a technical trend change. Understanding of time and confidence in price (plus a sell stop!) puts the investor in charge… and limits excessive worry. So, let’s go to the charts.
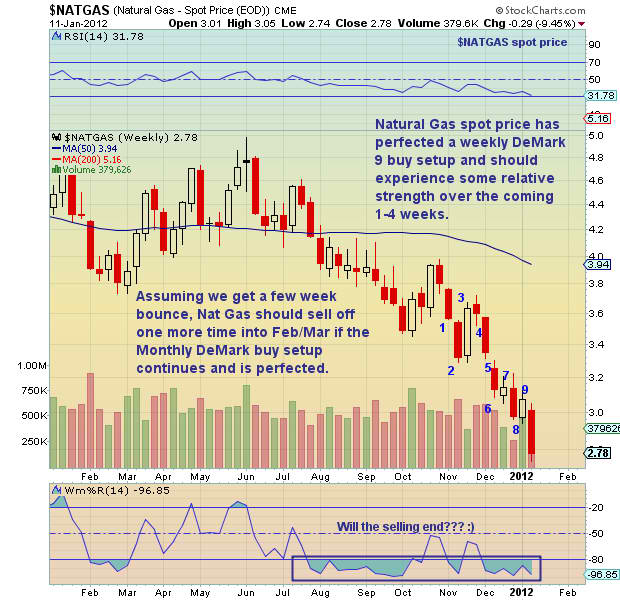
Technically speaking, they are brutal. And quite frankly hard to look at. I’m not sure that I can say with any confidence that the bear market will end soon. However, I can say that when applying DeMark analysis to the weekly charts, Natural Gas has recorded a DeMark 9 buy setup and is on the first bar of four where we could expect a reaction. Although this doesn’t guarantee a near term bounce, I would expect some realtive strength sometime in the next few weeks.
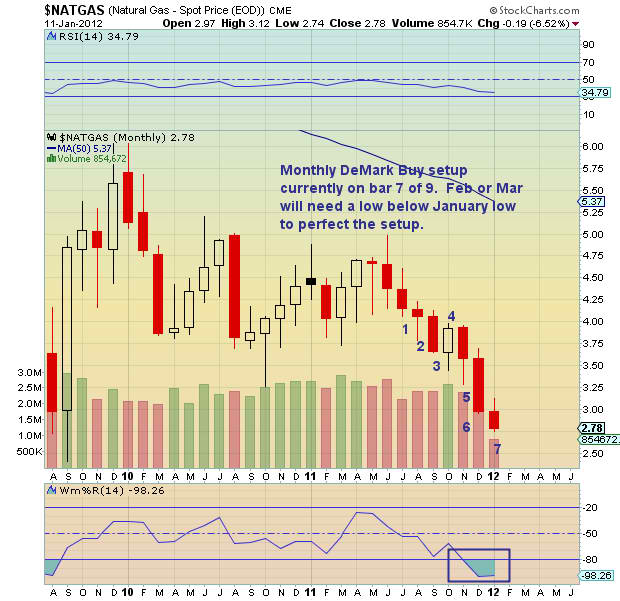
However, it was the monthly charts (below) that caught my attention. Although the charts look brutal and have not started to form a bottom (maybe the weekly setup will assist to that end?), there is a Monthly DeMark setup playing out that looks likely to record in March. Currently on bar 7, we will need a lower low than this month in Feb or March to perfect. This would set the stage for a nice bounce. A healthy bounce? Not so sure. But watching the technicals as this unfolds will be key for investors to get in at a lower risk price and furthermore, to know when and where to exit.
As it stands now, the gap at 3.30 and resistance around 3.80 look like magnet areas that may come into play sometime this year. But a lot will depend on price developments over the coming months (i.e. shape of bottom and just how low the price ultimately drops to). Other potential pricing influences include political platforms/announcements and dollar weakness/strength. Note that the current price is nearing very long term support on 20 year chart. Related stocks include Chesapeake Energy (CHK) and bigger, more diverse energy players like BP p.l.c. (BP) and Exxon Mobil (XOM). All are holdings in the popular index fund Select Sector Energy (XLE).
Happy investing.
———————————————————
Your comments and emails are welcome. Readers can contact me directly at andrew@seeitmarket.com or follow me on Twitter on @andrewnyquist or @seeitmarket. For current news and updates, be sure to “Like” See It Market on Facebook. Thank you.
No positions in any of the securities mentioned at time of publication.
Any opinions expressed herein are solely those of the author, and do not in any way represent the views or opinions of his employer or any other person or entity.


