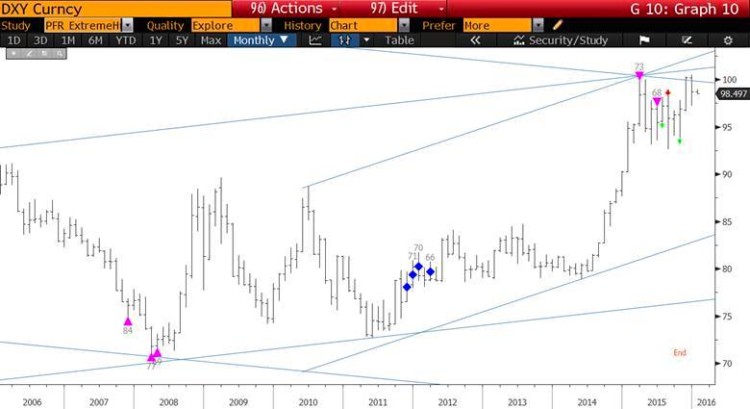
One of my favorites trading setups thus far this year is taking shape in the US Dollar Index futures ($DX_F). Check out the monthly chart of the US Dollar index below and the Extremehurst top extension sell signal. The last time we saw this type of sell signal was in August when I warned of stock market top. So the big question now: Is the US Dollar Index topping?
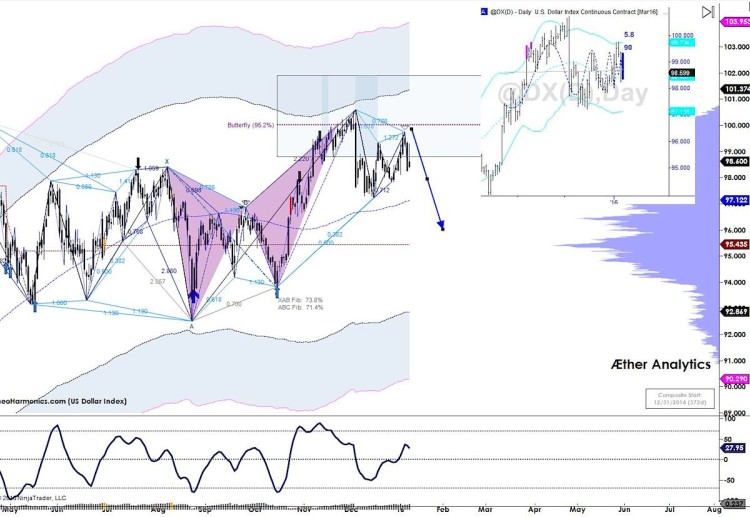
The monthly top extension will likely keep the US Dollar index flat to lower for around 1.5 years. But that isn’t the only bearish chart on my radar. I’m also seeing a bearish harmonic pattern on the US Dollar index as it bumps into a key resistance level.
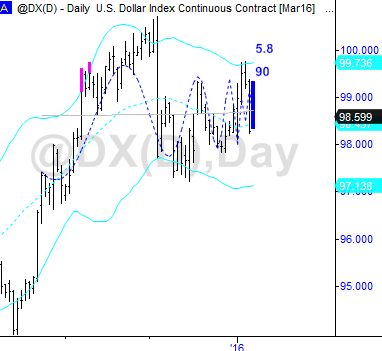
You’ll also notice the chart below that showing a high daily compression ranking… another sign that trend change is nearing. Remember that new trends often begin at compressions.
Although compresions are not necessarily indicative of “direction”, new trends tend to launch from similar points. Thanks for reading.
Twitter: @interestratearb
Author is looking for related directional trades at the time of publication. Any opinions expressed herein are solely those of the author, and do not in any way represent the views or opinions of any other person or entity.


