Looking Back
Most investors will be happy to have 2015 in the rear-view mirror. The S&P 500 Index eked out a 1.4% return including dividends. Excluding dividends it was down -0.73%.
A total return of 1.40% for the S&P 500 is the worst annual return since 2008. Overall, that sounds rather tame, but both the stock market and bond market gyrated more in 2015 than they have since 2009.
Perhaps the economic growth picture isn’t quite as good as the Federal Reserve is painting. If you’ve been reading my work, you know my thoughts on this (more below).
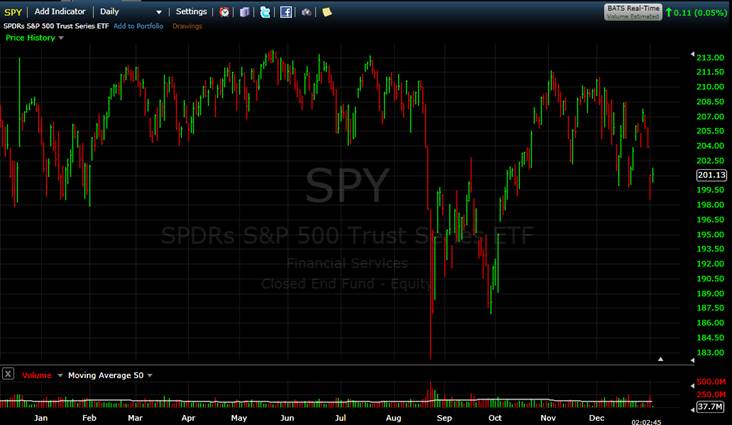
S&P 500 Chart
The post 2008 crash high for the S&P 500 occurred on May 21st, 2015 and, as you can see in the above chart, it plunged 14.6% in August. Prior to that, the S&P 500 had gone several years without even a 10% correction. Increased volatility in stocks may become the norm the next 6-12 months.
The S&P 500 represents some of the largest companies in the world. The Russell 2000 index represents a much broader group of mainly American companies in the stock market. In includes small and mid-sized companies that aren’t included in the S&P 500. As such it may be a better barometer for how the overall economy is doing in the U.S.
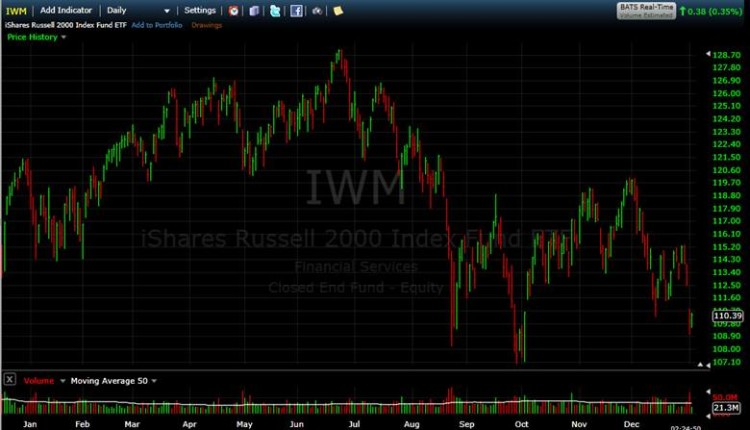
The Russell 2000 set a high on June 23rd, 2015 and ended the year down 14.4% from that high. As you can see in the chart below, the small and mid-sized US companies haven’t recovered the way their larger S&P 500 counterparts have.
I was not heavily invested in stocks throughout 2015 because it was becoming more and more apparent to me that economic growth was slowing globally. Stocks do best in strong growth environments and, I believe, when that growth starts to slow it is time to reduce stock exposure. That’s what we did and it protected us from stock market related drawdowns.
Bonds also saw increased volatility in 2015 (the only truly safe haven was cash). As the economy slows, junk bonds are the type most susceptible to losses and the JNK ETF (Junk Bonds proxy) was down roughly 14% for the year. Investment-grade corporate bonds (LQD) dropped around 7% from its high while 30-year US Treasuries (EDV) declined 18% from its high. The 20-year US Treasury ETF TLT was down 11.5% from its high.
Looking Ahead
The Federal Reserve raised interest rates in December amidst clear signs of slowing economic growth both globally and here in the United States. We are in a deflationary environment and I expect that to continue with the likelihood of the Unites States entering into a recession in 2016. The bottom line is that Central Banks around the world still have not found a way to create growth. Low interest rates and devalued currencies have kept the markets afloat, but in the end real economic growth is needed to sustain stock market based investments at or near their all-time highs.
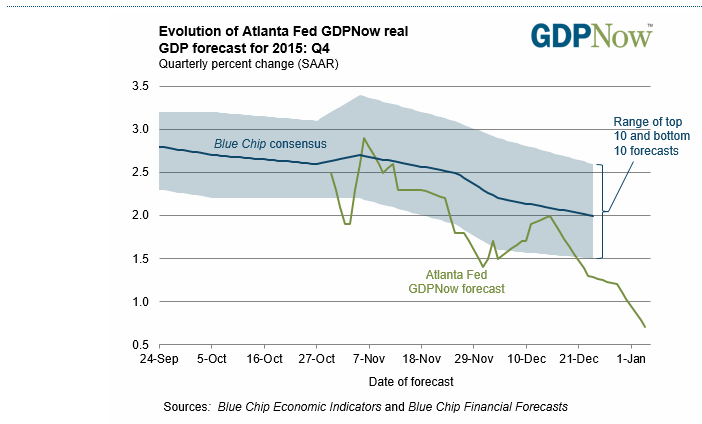
Interestingly, the economic data continues to confirm that growth is slowing. The Atlanta Federal Reserve reported on January 4th that the expected rate of 4th quarter GDP dropped from 1.3% (where it was when the Fed raised rates) to 0.7%. That chart makes the idea that our economy is growing pretty laughable:
Until stronger economic growth resumes, I expect to continue to avoid stocks while favoring cash and US Treasury bonds. The Fed may continue to raise rates a couple of more times, but each time they do so they will be increasing the probability of an economic crash as opposed to a more typical slowdown. It is more likely that they will delay any further increases as the trend of data slowing persists.
Already we have seen declines of 1-2% in the stock market in just the last few days. Expect that to become more normal. Our exposure to US Treasuries and cash typically means that we do well as stocks drop. I continue to closely monitor the markets and economic events adjust accordingly.
Twitter: @JeffVoudrie
Any opinions expressed herein are solely those of the author, and do not in any way represent the views or opinions of any other person or entity.

