Chinese stock market investors have endured a wild (and tough) year, as a key market index (the Hang Seng) declined sharply in 2015. The Hang Seng Index has been under pressure much of the year and broke below a key multi-year support level this year.
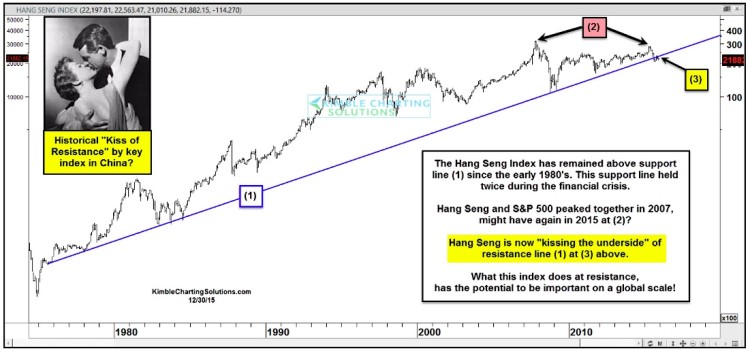
In the chart below, you can see this bearish price action marked at point (1).
This trend line support has supported the bull market for over 30 years. Right now, the Chinese stock market index has rallied back up to the underside of this resistance. And, frankly, what happens here may have an impact on the global financial markets.
The Hang Seng stock market index and the S&P 500 Index peaked together in 2007. And low and behold, they might have done the exact same once again in 2015 – see point (2). What’s even more interesting is that they also hit important price lows together in 2009.
Of late the Hang Seng index has broken 35-year support and is now testing the underside of this broken trend line at point (3) above.
Unless the Hang Seng Index can rally back above this resistance line, the chinese stock market may continue to underperform. And because of past “common” turning points, it makes sense to watch the S&P 500 to see if it can rally back above its highs.
If not, one may want to consider being underweighted the broader market.
In sum, how the Chinese stock market index performs over the coming weeks will likely be important to US stocks as well.
Hang Seng Index – Long-Term Market Chart
Thanks for reading.
Twitter: @KimbleCharting
The author does not have a position in the mentioned securities at the time of publication. Any opinions expressed herein are solely those of the author, and do not in any way represent the views or opinions of any other person or entity.


