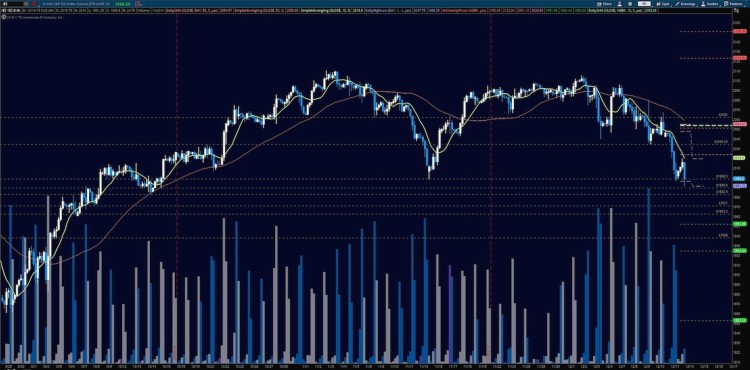
Today is options expiration day. S&P 500 futures (ES_F) exhausted its upside pattern and has fallen back into strong congestion areas. Notice my commentary yesterday:
“Charts have expanded almost 90 points in the ES_F in three days. The move is not sustainable without a pullback”, and “Watch for lower highs to give the signals that the upside is fading when charts are expanding like this”.
If you were bullish mentally, you were looking for buyers the entire day when I said buyers should find support to engage. If you were bearish, you were looking for the chart to reverse its hold. This is a lesson in mental framing. The fact is, that intraday trading is all about paying attention to support and resistance and realizing if support is broken and fails a retest, sellers will gain confidence. The reverse is also true of resistance and buyers.
Today presents a story of buyers trying to hold support areas between 2015-2018. It is been penetrated several times only to return to the range. It is presents a nice setup on the day.
Short term support is now near the 2015.5 mark; and resistance near 2037.5. Momentum readings are negative and falling– that resistance should hold. We should look for higher lows and higher highs to signal the break in downside momentum and a return to upward motion. If the wave structure shifts to this pattern, we will stop the decline.
Short time frame momentum indicators are negative and falling, and lower than Thursday. Longer cycles are downward trending, and back into neutral territory.
See today’s economic calendar with a rundown of releases.
RANGE OF TUESDAY’S MOTION
Crude Oil Futures (CL_F)
Moving average squeeze has appeared on the 4 hour chart yesterday and continues to hold. Watching the resolution here will be key. It spent all day in the squeeze yesterday, but this has formed a resolution pattern for us to keep an eye out to develop. Though I still anticipate further downside, I see very jagged price action here, so we could pop sharply before reversing. It will not be simple to trade. We are still looking for the higher lows to continue as they have held in the squeeze. Short term support still sits at 35.94. Resistance lies near 36.7, then 37.2, if that is breached and holds. For an intraday trading formation, we see a range event between 35.94 and 36.43, noting that momentum and trend are both neutral to bearish, and holding steady in shorter time frames. Breach above a 36.43 sends us to congestion near 36.6-36.7. If we hold that, the move sends us to 38.89, then 37.14 and perhaps 37.7. Below a 35.94 failed retest sends us to 35.8, 35.57, 35.4 and perhaps 35.18. Momentum on intermediate time frames is positive but falling.
E-mini S&P 500 Futures (ES_F)
This week’s chart with active S&P 500 futures support and resistance trading levels. Click to enlarge.
Upside motion is best setup on the bounce off the 2021 recovery. The long would be countertrend here but it appears we are attempting reversal. A breach and retest that holds off 2026 makes a reasonable setup as well. The breach of 2027 will likely bring excited buyers in but watch momentum carefully here. If momentum holds, we could see 2032.75, 2035, and 2037.5 in the coming days.
Downside motion below the failed retest of 2015.5, or at the exhaustion formation that might show up at 2037.5 – momentum will be key as well as market structure as it relates to the trending waves. Retracement into lower levels from 2015.5 gives us the targets at 2012, 2010.25, 2007.75, 2004.75, 2001.25, and 1998.75.
If you’re interested in the live trading room, it is now primarily futures content, though we do track heavily traded stocks and their likely daily trajectories as well – we begin at 9am with a morning report and likely chart movements along with trade setups for the day.
As long as traders keep themselves aware of support and resistance levels, risk can be very adequately managed to play in either direction as bottom picking remains a behavior pattern that is developing with value buyers and speculative traders.
Twitter: @AnneMarieTrades
The author trades futures every day and may have a position in mentioned securities at the time of publication. Any opinions expressed herein are solely those of the author, and do not in any way represent the views or opinions of any other person or entity.


