Last week was a short Holiday week for stocks marked by low volume. But, even so, there was some good price action. The Russell 2000 ETF (IWM) and and the iShares Biotech Sector ETF (IBB) were the star performers while the S&P 500 ETF (SPY) and Nasdaq 100 ETF (QQQ) were mostly consolidating gains from the past weeks.
In my opinion, this type of illiquid listless action can be expected for the next 1-3 weeks until the FOMC decision.
There is quite a bit of overhead supply and/or resistance levels on the charts. As mentioned above, if the S&P 500 ETF (SPY) could consolidate for the next 1-3 weeks between 208.40 and 211.66 and that would be the most bullish scenario for SPY heading into year end.
However, it should be noted that in 2015 follow through has been rare. While seasonal stock market trends are positive, keeping an open mind about stocks will certainly help traders or investors prepare for the end of year rally or breakdown.
There has been quite a few posts on my Stocktwits and Twitter stream about fund outflows, the Shanghai Composite dropping 5.5% last week, Corporate Junk bonds (tickers JNK and HYG) looking heavy etc. These are things that you need to be aware of and be prepared if there is a larger than expected move to the downside.
From a broader perspective though, the range for the S&P 500 Index as I see it is 2060-2135. That is the consolidation zone with 2020 being the bigger support, if we head lower.
Market breadth has been positive for the last week or so, even though the overall breadth underneath the surface has been deteriorating. Examples are the Cumulative A/D, Cumulative Summation Index and the Cumulative TICK are looking good. The CBOE Volatility Index (VIX) has moved lower despite some minor pops and may continue to do so. To add to all this, the micro-caps (IWC) and small-caps (IWM) stocks had huge jumps last week. And as I mentioned earlier the seasonal trends and the investor psychology around this time bode well for the bullish thesis and a stock market run higher into the end of the year or early 2016.
Here’s some input from Ryan Detrick (@RyanDetrick) on Midcap Stocks Performance:
As far as Economic reports go for the upcoming week, it is very heavy. We have Chicago PMI, PMI Manufacturing Index, ISM Mfg Index, ADP Employment Report, Beige Book, NFP and many more. And there is no dearth of Federal Reserve speakers from Federal Reserve Chair Janet Yellen to James Bullard or Dennis Lockhart. In fact, Janet Yellen talks twice next week including a Testimony on Thursday.
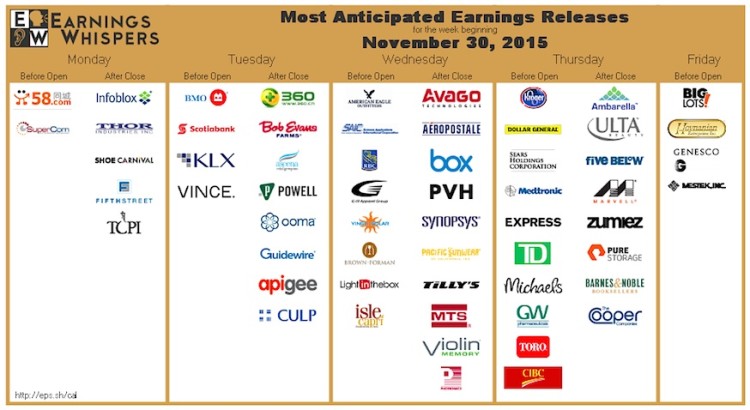
And here are some of the Earnings due next week via Earnings Whispers (@eWhispers). Not a whole lot but some interesting ones like Kohls (KSS), Ulta Salons (ULTA), Dollar General (DG), TD Ameritrade (AMTD), Zumiez (ZUMZ) report earnings on Thursday while Big Lots (BIG) reports earnings on Friday.
Alright, let’s delve into market breadth and select stock market indicators.
MARKET BREADTH INDICATORS:
Sector Performance Candlestick Glance:
Here’s the view of S&P sectors with respect to RSI. None of the sectors are overbought or oversold yet from a longer term perspective. $XLK, $XLF, $XLP and $XLY look promising into next week. click to enlarge
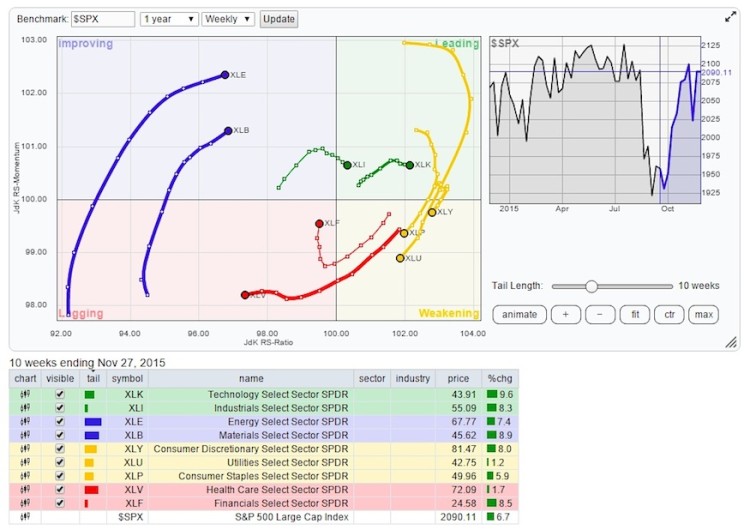
The Relative Rotation Graph (RRG) chart showing the leaders and the laggards among the 9 sectors.
CPC – Put/Call Ratio:
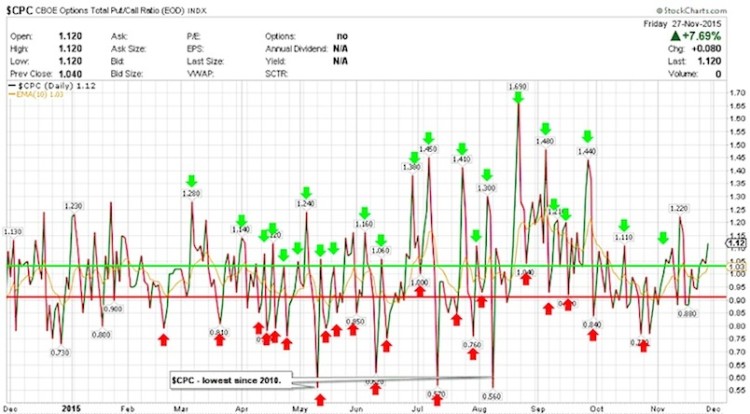
The Put Call ratio started rising a tad out of the range of 0.8-0.95 to finish at 1.12.
The Equity only put call ratio $CPCE (not shown here) is rising and finished the week nicely at 0.760. The 10 day MA on this chart is seen to be rolling over and that is a very good sign for the bullish thesis.
continue reading on the next page…


