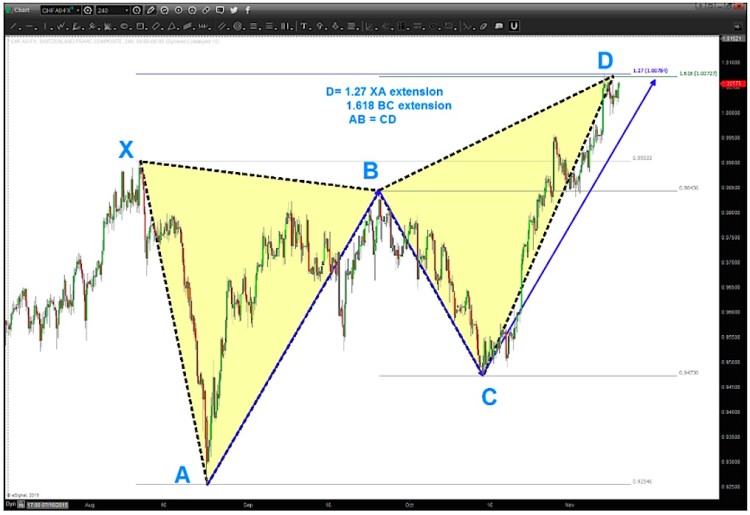
The USDCHF (US Dollar / Swiss Franc Forex pair) has formed a nice pattern setup. The pattern formed due to the strength shown by the US Dollar and weakness in the Franc in 2015. The pattern is a USDCHF sell pattern, meaning that traders could look for a pullback in the pair.
However, if the USDCHF sell pattern fails then it likely means that the US Dollar is taking off…
I think this is a good pattern so, at a minimum, I expect some weakness in the Dollar vs Swiss France (USD vs CHF) in and around current levels.
Here’s a look at the harmonic butterfly “sell” pattern. Like I said, we know we are wrong if it breaks higher and disregards the pattern resistance levels.
USD/CHF Chart – Harmonic Sell Pattern Setup
When looking for butterfly patterns just think of it as connecting two triangles. The key to the butterfly is the AB=CD leg that makes the high or low. If you have that along with the extension targets mentioned in the chart above then you have a butterfly sell (or buy) trading setup occurring.
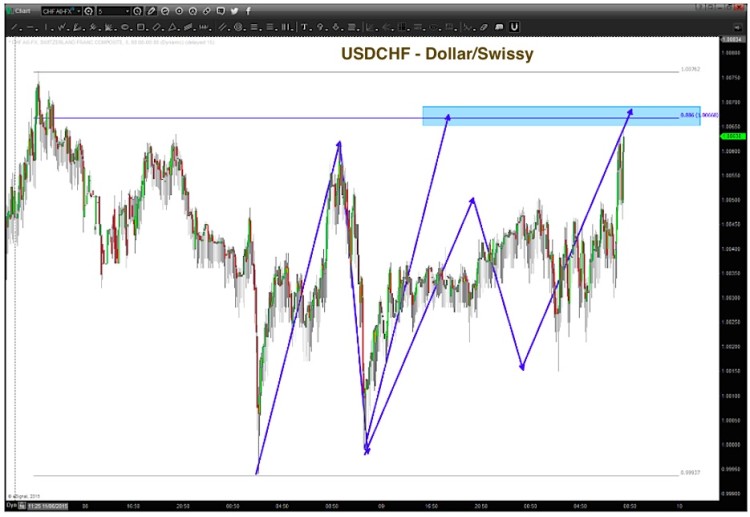
Here’s the intraday picture that will give us an idea if this pattern will hold or not. Watch these resistance levels closely.
USDCHF Chart
Thanks for reading and good luck trading.
Twitter: @BartsCharts
Author does not have a position in mentioned securities at the time of publication. Any opinions expressed herein are solely those of the author, and do not in any way represent the views or opinions of any other person or entity.


