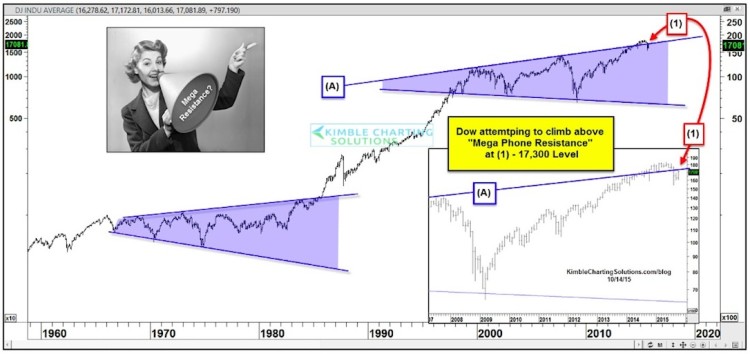
If we go back over 60 years and look at a chart of the Dow Jones Industrial Average, we can see that this major stock market index formed what looks like a long-term Dow Jones Megaphone pattern. This pattern helped investors spot a bullish breakout (higher) in the 1980’s. See chart below.
So what happened? Well, in short, when it took out the overhead resistance line of the Dow Jones megaphone pattern, it followed through higher and triggered a new stage of the bull market.
Last summer, the Dow Jones briefly broke above a similar resistance line within a similar megaphone pattern. This pattern has been built based upon the 2000 and 2007 highs. But the breakout didn’t hold.
The recent stock market correction took the Dow Jones back below support (see line (A) below). But it is once again toying with this resistance level.
Is this pattern making investors nervous? Yesterday I had a post showing that investors are betting big time on a Black Swan event.
Another Dow Jones Megaphone Pattern?
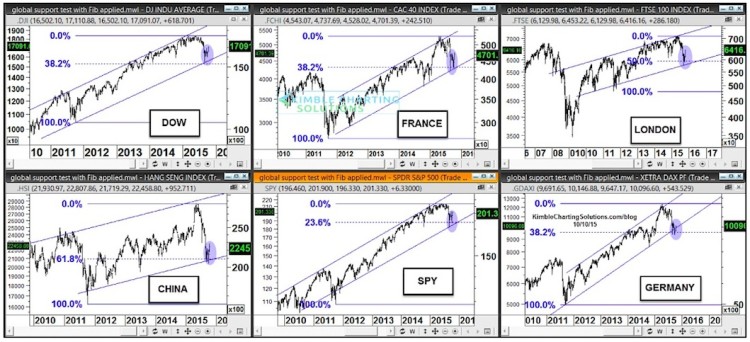
The broader global stock markets remain inside their multi-year rising channels, so technical support is still holding around the world. Check out the charts below of US, China, France, Germany, and London market indices.
So what’s the take away here? Global markets have experienced short-term declines in longer-term rising channels. Each markets decline of late took it down to critical support, where each reversed course and rallied higher (note the Fibonacci retracement levels on the charts above too!).
I don’t know what is giving investors reason to bet on a “Black Swan” right now, but I will say this: I’ll be concerned if the Dow Jones megaphone pattern fails at resistance and the decline takes out channel support.
Thanks for reading.
Twitter: @KimbleCharting
Any opinions expressed herein are solely those of the author, and do not in any way represent the views or opinions of any other person or entity.


