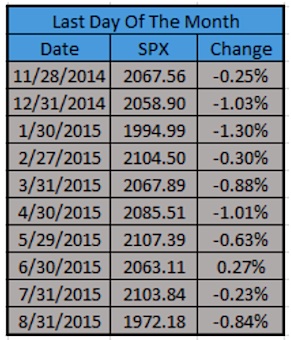
Today is the last day of the month and lately it has been pretty rough on stocks, down nine of the past 10 months (based on the S&P 500). Looking back through historical stats, it made it to 10 of 11 just once and that was way back in 1932.
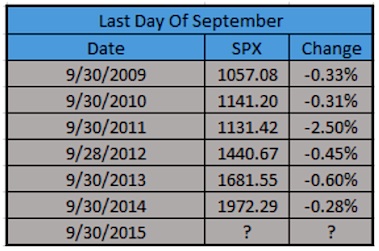
Looking at this month, the last day of September has been down six years in a row. That is quite a trend for stocks. Perhaps it ties in with the seasonally weak period at the end of September.
Note that the last day of September was down seven years in a row once back in the 1950s.
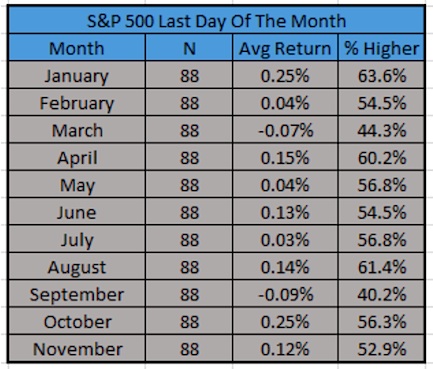
In fact, the last day of September is historically the worst last day of the month for the stock market. It is higher just 40% of the time and one of just two months with a negative average return on its last day.
The good news? The S&P 500 is currently up over 1% at mid-day. There’s a few hours of trading left, so the big question is: Can it stick?
Thanks for reading and have a great weekend.
Twitter: @RyanDetrick
Read more from Ryan on his tumblr.
Any opinions expressed herein are solely those of the author, and do not in any way represent the views or opinions of any other person or entity.


