“Most of my colleagues and I anticipate that it will likely be appropriate to raise the target range for the federal funds rate sometime later this year and to continue boosting short-term rates at a gradual pace thereafter as the labor market improves further and inflation moves back to our two percent objective.”
That is a quote from Janet Yellen’s, Federal Reserve chair, speech last Thursday. The tone is much more hawkish than either the FOMC statement on the 17th or during her post-meeting press conference that day.
What does the phrase “…inflation moves back to our two percent objective” suggest? That Ms. Yellen, and her colleagues, think inflation expectations may begin to move up is interesting. And if they do not, they would rather wait and not rush into rate hike (or series of hikes)? After all, the other variable of the Fed’s dual mandate – employment – has seen steady improvement post-Great Recession, though the recent trend has softened.
The inflation trend (and inflation expectations) has not been on Ms. Yellen’s side, if that is her – and her colleagues’ – focus.
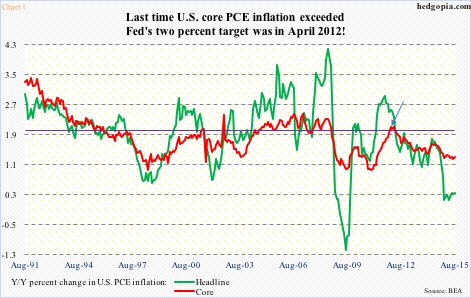
This morning, August’s personal income was published. Core personal consumption expenditures (PCE) inflation only rose 1.3 percent annually. Yes, it ticked up from 1.2 percent growth in July, which by the way was the lowest since March 2011, but the last time this series grew at a two percent annual rate was back in April 2012. This is the Fed’s favorite measure of consumer inflation, versus the consumer price index. Core CPI is running a little hotter – up 1.8 percent in August – but still below the Fed’s two percent objective.
As seen in Chart 1 (above), except for a brief five months ended April 2012, core PCE inflation has been under two percent throughout this recovery. In fact, we have to go back to September 2008 to see a two handle – shortly before QE began in late November of that year.
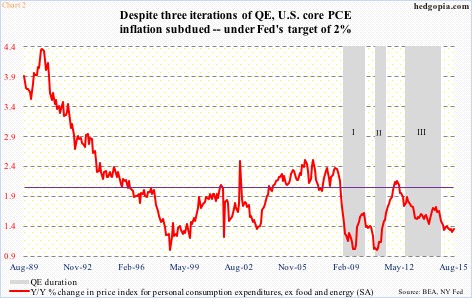
There is the rub. Despite three iterations of QE, during which the Fed’s balance sheet ballooned by $3.7 trillion, core inflation has refused to budge (Chart 2 below).
Not surprisingly, headline inflation is even lower – up a mere 0.3 percent in August (Chart 1), and has diverged with the core rate throughout this year as the collapse in oil price began to filter through the system. With that said, the green line in Chart 1 saw a recovery high as early as September 2011 (2.9 percent) – well before oil collapsed.
The ‘lower for longer’ trend has long been in the making.
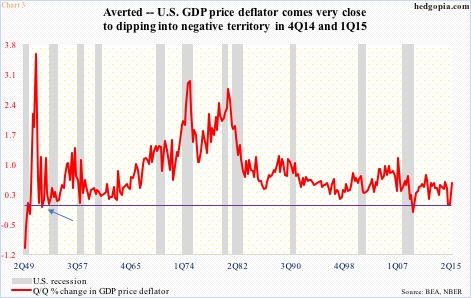
Some other measurements of inflation have been recording weaker readings. The GDP price deflator rose 0.5 percent in 2Q15, but not before nearly dipping into negative territory, with 4Q14 and 1Q15 barely rising at 0.2 percent and 0.3 percent, respectively (Chart 3). In fact, when 1Q was first reported, the red line in the chart was reported as a negative 0.1 percent. This was later revised away, but if it stuck, this would be quite a development. The last time this series had a negative reading was in the second and third quarters of 2009 – during and shortly after Great Recession ended – and in 1Q52 (arrow in Chart 3). That is how rare it is. Yet it is toying with negative territory.
This is all in the past. How about the future? At the end of the day, that is what matters. Hence the significance of Ms. Yellen’s optimism as regards to inflation moving back to the Fed’s two percent objective.
The markets are not buying it.
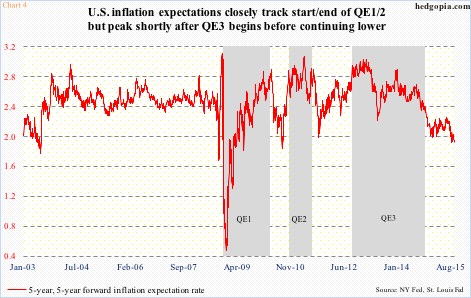
The five-year, five-year forward inflation expectations rate – expected inflation in five years – dipped to 1.87 percent last Thursday – the lowest since August 2010 (Chart 4 below). Rather curiously, the red line closely followed the start and end of QE 1 and 2. But during QE 3, it peaked earlier, and continued lower. Not sure what the message is – perhaps market participants losing faith in QE’s ability to ignite inflation expectations? Probably. If so, we can extend that logic to ZIRP (zero interest-rate policy) as well.
It seems getting off the zero bound interest rates is only possible if the Fed is willing to look the other way as regards to its two percent objective.
Thanks for reading!
Twitter: @hedgopia
No position in any of the mentioned securities at the time of publication. Any opinions expressed herein are solely those of the author, and do not in any way represent the views or opinions of any other person or entity.


