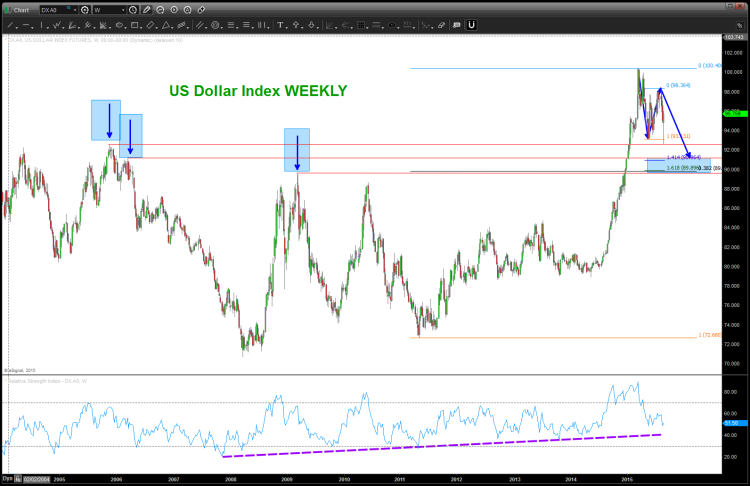
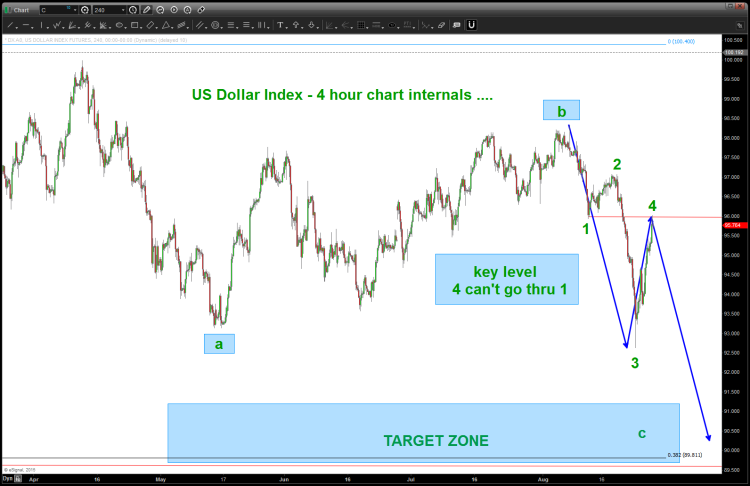
The US Dollar correction began in March, following a top and ensuing retest that failed in April. It has lasted about 5 months thus far and is likely to end soon (if you believe that a new bull market has started). And after the recent thrust lower, many traders are wondering if the US Dollar correction is officially over?
Perhaps.
Ideally – and fitting with my wave count – the dollar would see one more wave lower. But, either way, as you can see in the charts below, an A-B-C correction appears to be the structure of the move.
My thoughts on the subject are this: If we see a strong move past 96, then a new bull leg higher may be in the works. However, the dollar fails here, then it will likely make new lows and complete the correction (and turn higher from there).
If/When the US Dollar correction comes to an end, we should see the Dollar push to new highs and beyond. click to enlarge charts
Us Dollar Weekly Chart (Macro)
US Dollar 4 Hour Chart (ZOOM)
Thanks for reading.
Twitter: @BartsCharts
Author does not have a position in mentioned securities at the time of publication. Any opinions expressed herein are solely those of the author, and do not in any way represent the views or opinions of any other person or entity.


