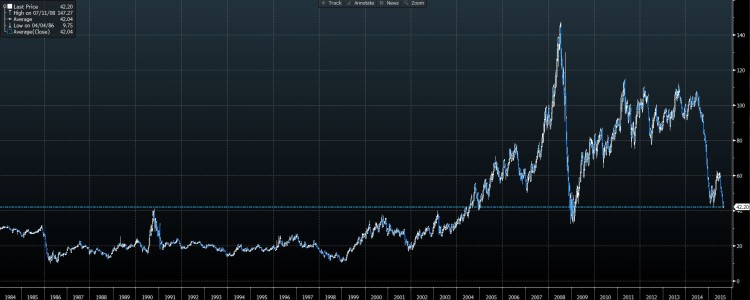
For the past several weeks I have been waiting for Crude Oil prices to get back down to current levels, around $42 per barrel. Why? Well I have a pretty cool chart to share.
The chart below depicts the range average of WTI Crude Oil prices all the way back to December of 1983. The average close for crude oil since then has been… yep, you guessed it 42.04. It’s interesting to see crude oil prices chopping around these levels for some time now.
Mean reversion. It will definitely be interesting to see how much Crude Oil overshoots. The behavior around this level is definitely worth watching going forward in my opinion. Furthermore, does the FED hint at a hike today? Should be interesting to watch heading into this Fall.
Crude Oil Prices – 30+ Year Chart
Have a great day and thanks for reading.
The material provided is for informational and educational purposes only and should not be construed as investment advice. All opinions expressed by the author on this site are subject to change without notice and do not constitute legal, tax or investment advice.
Twitter: @stockpickexpert
No position in any of the securities mentioned at the time of publication. Any opinions expressed herein are solely those of the author, and do not in any way represent the views or opinions of any other person or entity.


