US Treasury bonds appear to be on track for higher prices into the end of the year, but the final stretch promises to be choppy. Here we show the areas where we are watching for a downward reversal in treasury bond prices and a low (or floor) in treasury bond yields.
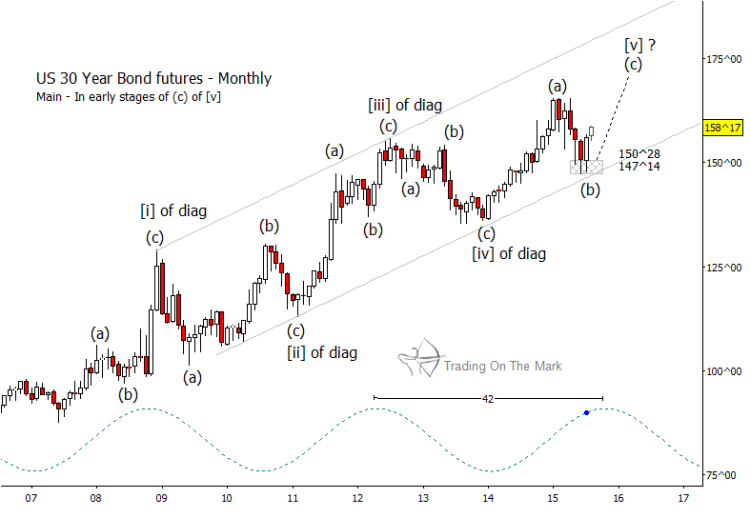
It really is impossible to ask more from this monthly bond count, which has kept us on the right side of all the zigs and zags in treasury bonds for years now. Treasury Bond futures should now be in the last stage of the ending diagonal.
Note how price bounced out of the target area for intermediate wave (b) on the monthly chart and channel support on the weekly chart.
30 Year Treasury Bond Futures – Monthly Chart
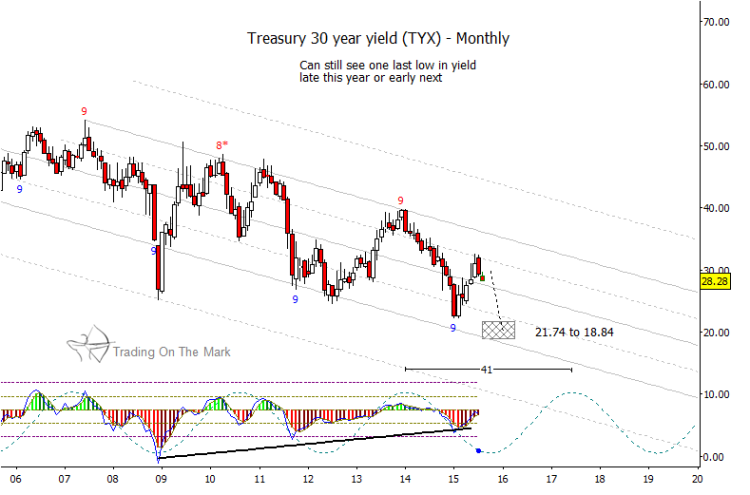
The corresponding monthly chart for 30-year US Treasury yields (TYX) shows channel support and Fibonacci-derived targets for late 2016. As you would expect, the projected low for the 41-month cycle in treasury bond yields lines up well with the projected high in the 42-month cycle for Treasury bond futures.
30 Year Treasury Bond Yields – Monthly Chart
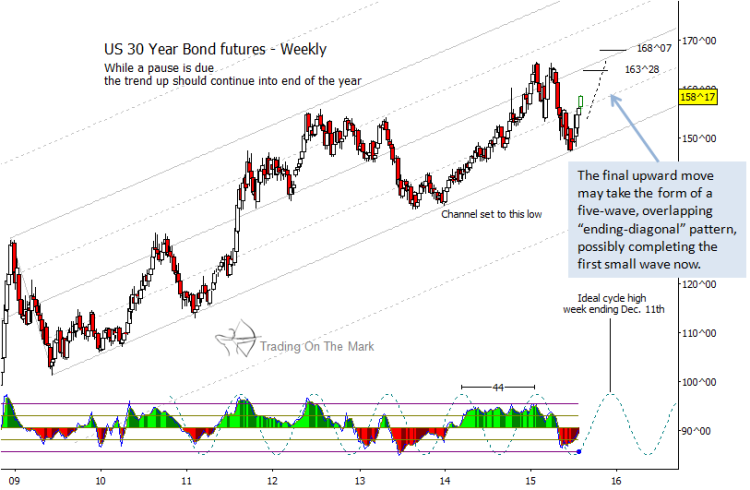
Since most in the financial world are expecting the FOMC to announce a change in interest rates sometime during the next six months, it makes sense that the next segments on bond and yield charts will be choppy into the pattern completion. For treasury bonds, we expect the final move to take the form of a five-wave overlapping “ending diagonal,” with resistance areas possibly near 163^28 and 168^07.
30 Year Treasury Bond Futures – Weekly Chart
Going forward, our subscribers will be following the move on a daily chart to fine-tune the targets. Be ready for the trades before the market sees them. Thanks for reading.
Twitter: @TradingOnMark
No position in any of the mentioned securities at the time of publication. Any opinions expressed herein are solely those of the author, and do not in any way represent the views or opinions of any other person or entity.


