In a post back in February, we suggested that long-term bonds were ready to put in a substantial correction. That move now appears to be nearing completion, and it is unclear whether prices will retrace as far as our original target. This is reason enough to keep an eye on US Treasury yields in the weeks ahead. Soon – perhaps within the next few weeks – there may be a moderate-risk opportunity for traders to seek higher bond prices. More importantly, the market probably will offer a window in late 2015 or early 2016 for long-term investors to position themselves to benefit from rising interest rates and treasury yields and a real trend change in bond prices.
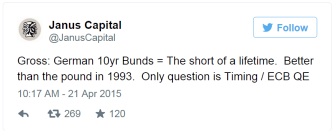
We are not alone in expecting treasury bond prices to form a lasting high and interest rates to begin rising within the next one or two years. As Bill Gross of Janus Capital indicated recently in a tweet (see below), long-term treasury bonds could represent the short of a lifetime, but the problem is timing the trade. We believe that is where our style of technical analysis can help.
In this post, we present charts for the most prominent interest rate index and for an ETF that tracks long-term U.S. year treasury bonds. Readers can find a more detailed analysis of treasury bond futures and price targets in our next eBook, which will be published through our website and through Amazon a few days hence.
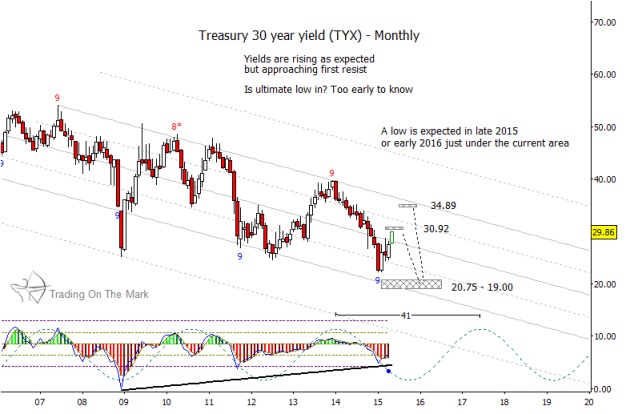
The monthly chart below shows how the CBOE 30-year Treasury Yields Bond Index (TYX) has followed an orderly decline for almost a decade. Note in particular how well the index has behaved with respect to the channel drawn on the chart, and how well the Wave59 exhaustion signals have caught the turns. Technical analysis works with this index almost as well as it works with actual traded issues. We expect the index to find resistance fairly soon before making another test of lows.
CBOE 30-year Treasury Yields Bond Index (TYX) – Monthly Chart
Near-term upward price targets for TYX are based on Fibonacci extensions from the internal waves of the rally from February 2015. Either of those regions might cap the current rise in treasury yields.
The eventual support region of 19.00 – 20.75 along with the 41-month cycle in yields suggest we should watch for a real low in treasury yields late in 2015 or early in 2016. That event may correspond to a high in treasury bond prices.
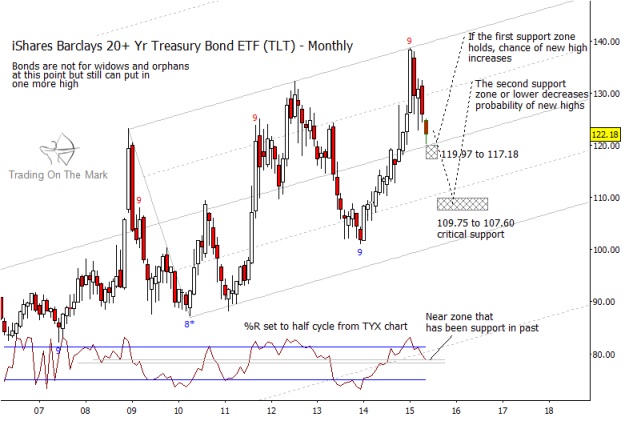
Next, the monthly chart for the iShares 20+ Year Treasury Bond ETF (TLT) may be more directly useful to traders and investors. Following a path similar to that of actual treasury bond prices, the ETF may find support near its present area, between 117.18 and 119.97, although the current decline could extend to nearer the bottom of its channel, around 107.60 to 109.75. Based on past behavior of the %R indicator, it is reasonable to expect at least some consolidation or bounce from the higher support area before the market decides whether to try to head lower during the summer.
Our primary scenario for treasuries has them forming one more higher price high late this year or early next year. On the other hand, our next-most-favored scenario suggests treasuries might form a lower high within the same time window. The behavior of the ETF near the two support areas may provide a clue about which scenario is playing out. In either case, the big-picture message is for investors to prepare themselves for higher interest rates and lower bond prices.
iShares 20+ Year Treasury Bond ETF (TLT) Monthly Chart
Our subscribers over at Trading On The Mark have access to timely charts and analysis for a wide range of markets – right now you can get five examples delivered to your inbox for free.
Follow Tom & Kurt on Twitter: @TradingOnMark
No position in any of the mentioned securities at the time of publication. Any opinions expressed herein are solely those of the author, and do not in any way represent the views or opinions of any other person or entity.


