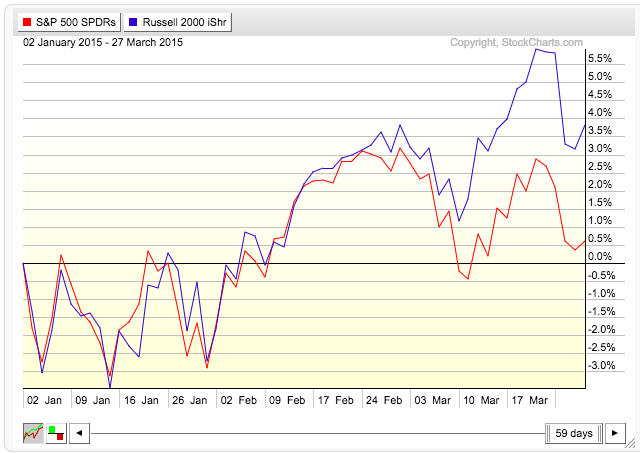
Despite the nearly identical drops of 2.2% this week by the Russell 2000 ETF (IWM) and S&P 500 ETF (SPY), the small caps have been the overwhelming success thus far in 2015. Year to date, the small caps have gained nearly 3% while the S&P 500 is hovering just above break even at +0.5%. The majority of the small caps outperformance has come in the last month.
That performance gap is best illustrated in the chart below, pitting IWM vs SPY:
As we close out the first quarter and corporate earnings season begins to ramp up, what should we expect from the Russell 2000 and small caps stocks?
Let’s take a look at the charts and some seasonality patterns.
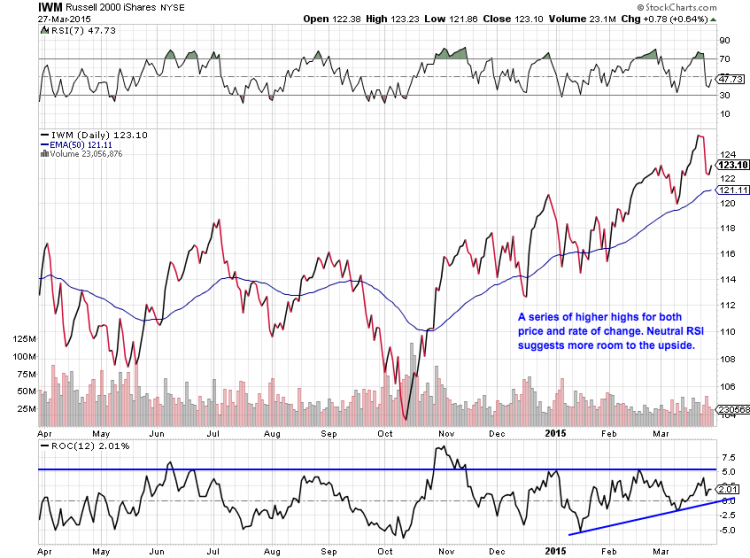
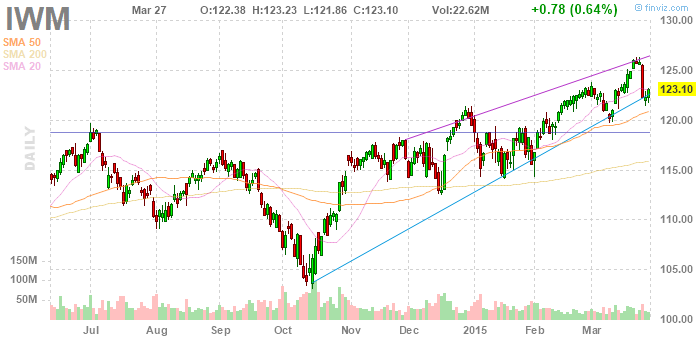
The Russell 2000 (IWM) tagged an all-time high on Monday before closing just shy of the 126 level. As we see from the chart below, IWM has made a series of higher highs and higher lows, a classic sign of a strong uptrend.
Adding further credence to the bullish argument for the small caps is the ascending rate of change and the relatively neutral relative strength measure, both of which favor the upside.
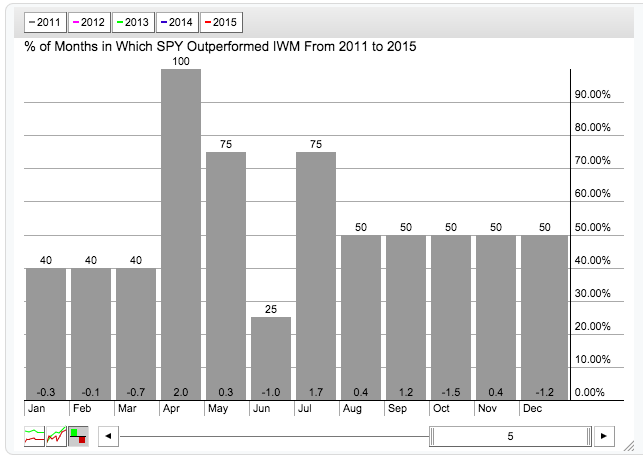
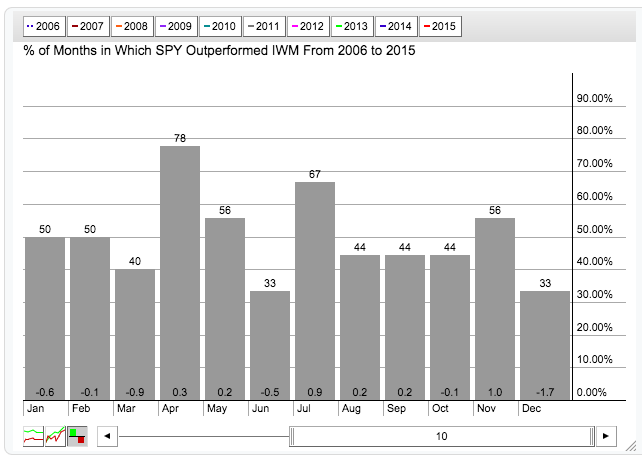
But at the same time, seasonality may be a possible hiccup for those bullish the small caps. As we noted on social media earlier this week, large caps have a strong seasonal tendency to outperform small caps in the month of April. This tendency has been evident in all look-back periods over the past 15 years. Over the past 5 years it has happened 100%.
The past is never any guarantee of future events but the stark outperformance of the Russell relative to the large caps may be reaching an extreme. This is something to monitor as you’re planning your trades into Spring. Note that our model, BetterBeta Trading, holds neutral options positions in the RUT index. Thanks for reading and have a great week.
Any opinions expressed herein are solely those of the author, and do not in any way represent the views or opinions of any other person or entity.

