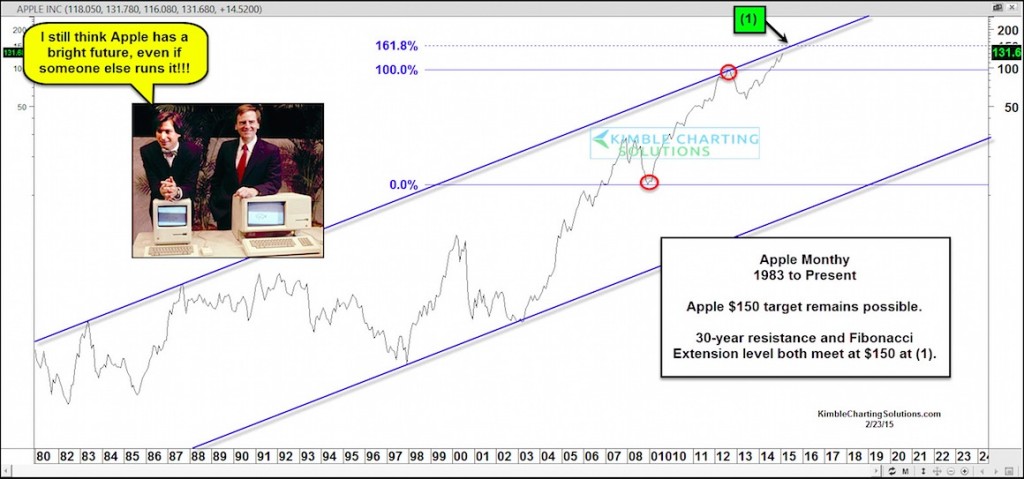
Back in November I shared a chart of Apple (AAPL) showing its upside potential based on its long-term uptrend channel and October breakout to new highs. At that time, it was trading at $109 and I made the case for a potential AAPL price target of $150 based on a confluence of uptrend resistance and a Fibonacci breakout extension level.
I’ve been tracking that Apple chart and providing updates on my blog as well. The stock has made significant progress, closing today up another 2.71% at $133. Suddenly that AAPL price target is looking more realistic.
At the same time, it’s important to note that Apple’s stock price is up 22 percent since its earnings report just 4 weeks ago. Stocks typically don’t move in straight lines… nor do they tend to hit our “targets” exactly. Price targets should be used as a frame of reference to see where a stock may be headed. Whether its $140, $145 or $150+, Apple continues to push higher.
Apple Long-Term Chart
Thanks for reading.
Follow Chris on Twitter: @KimbleCharting
Author may have positions in mentioned securities at the time of publication. Any opinions expressed herein are solely those of the author, and do not in any way represent the views or opinions of any other person or entity.


