Measuring sector relative strength can be a great way to gather information about emerging trends within the market. And building a mosaic from various sectors really compounds the information they offer. This information allows us to get a pretty good sense for the state of the market. Let’s give it a whirl.
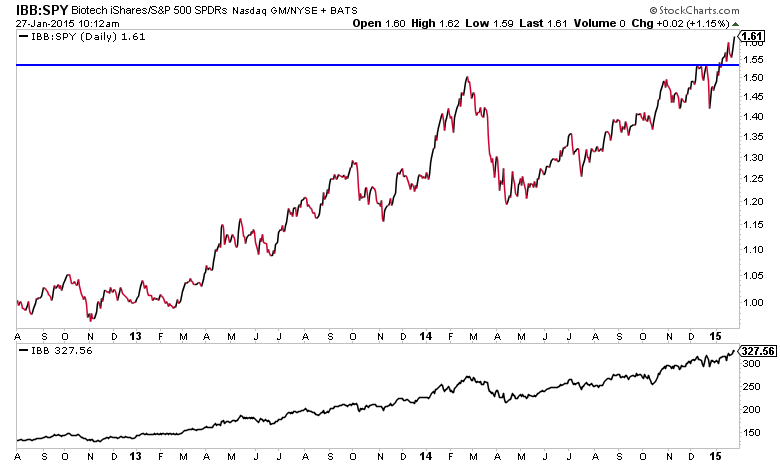
The market leading group continues to be the Biotech Sector (IBB) as its relative strength to the S&P 500 SPDR ETF (SPY) is pushing to new highs. What an anchor this sector has been!
IBB – Biotech Sector ETF Chart
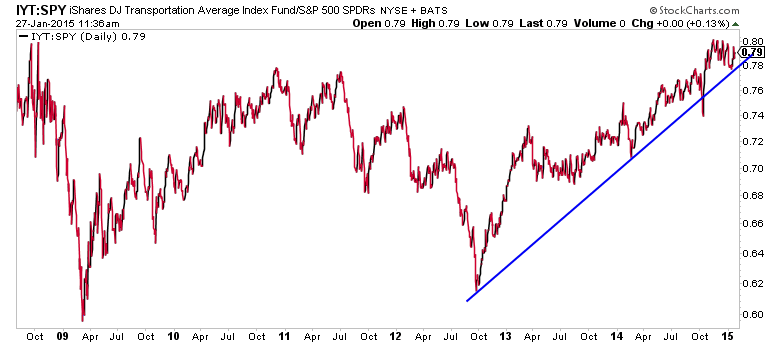
The transports have been a major source of sector relative strength for months. While the airlines continue to new highs, the iShares Transportation Sector (IYT) relative to the S&P 500 SPDR (SPY) has begun to move sideways. Still, the multi-year uptrend is intact, so perhaps it is consolidating.
IYT – Transportation Sector ETF Chart
Semiconductors have been another bright spot for the market for some time now. The Market Vectors Semiconductor ETF (SMH) relative to SPY continues to trend higher.
SMH – Semiconductors Sector ETF Chart
Shifting to the defensive groups, we’ve seen a clear trend emerge in a push for bond-like equities. There is strong relative strength across each of these sectors.
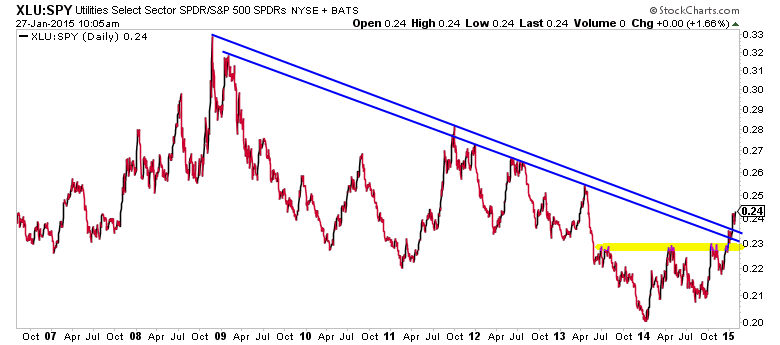
Looking at the Utilities Sector SPDR (XLU) relative to the S&P 500 SPDR (SPY), we see a break out from resistance dating back to 2009. Within that we also see a year and a half base breakout higher. The posture here is strong and it suggests we’ll see more utilities outperformance in 2015.
XLU – Utilities Sector ETF Chart
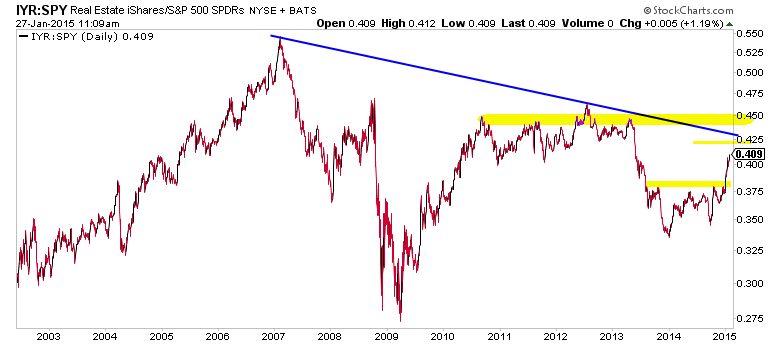
The Real Estate iShares (IYR) relative to SPY has also recently broken a year and a half base. It’s quickly approaching the measured move area. Beyond that we see a heavy resistance confluence including trend resistance from the 2007 peak.
IYT – Real Estate Sector ETF Chart
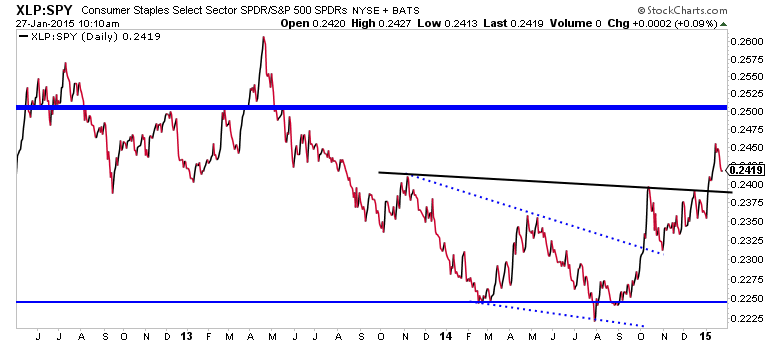
The Consumer Staples SPDR (XLP) is showing strong sector relative strength to the S&P 500 SPDR. After breaking a year and a half bottoming base, the intermediate trend is now higher.
XLP – Consumer Staples Sector ETF Chart
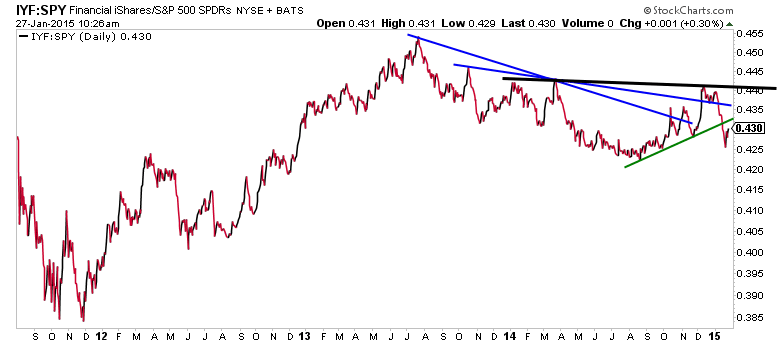
One major recent happening is the break down in the Financial Sector. Is is showing weak sector relative strength (to the S&P 500), recently breaking its corrective half year uptrend. It’s pretty clear this group is currently out of favor.
IYF – Financials Sector ETF Chart
Although there is a clear bid for bond-like equities, the strength in leading cyclical groups like the semiconductors and transports suggest enough strength for the market to stand on its own two feet. However, that leadership needs to expand to other cyclical sectors or the market could see another shoes drop.
Thanks for reading and trade safe.
Follow Aaron on Twitter: @ATMcharts
No positions in any mentioned securities at the time of publication. Any opinions expressed herein are solely those of the author, and do not in any way represent the views or opinions of any other person or entity.

