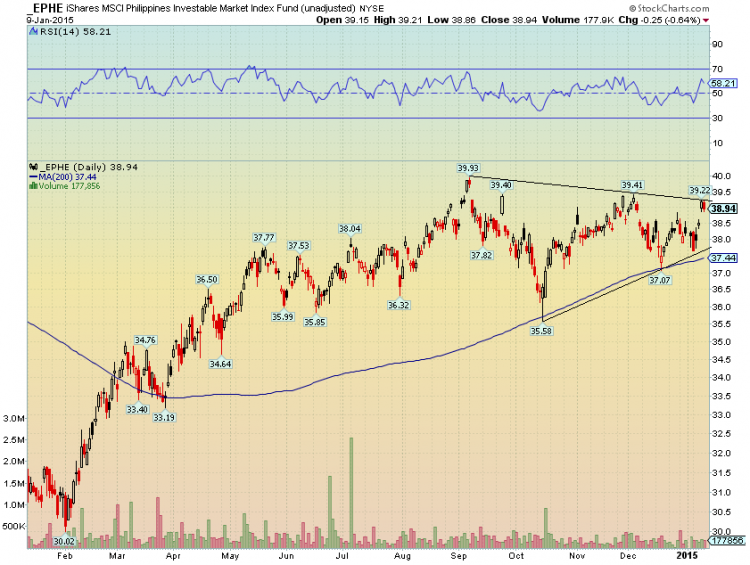
 The iShares MSCI Philippines ETF (EPHE) continues to consolidate after its September 2014 peak. A coil pattern has developed on the daily chart in the last several months, with the 200 day moving average providing downside support. This continuation pattern on EPHE would confirm itself should the ETF break above the $40 area.
Note that the Philippines ETF touched its downtrend resistance line off the September peak last week, so there could be some near-term selling. However, the play is on a breakout of the symmetrical triangle.
Philippines ETF (EPHE) Daily Chart
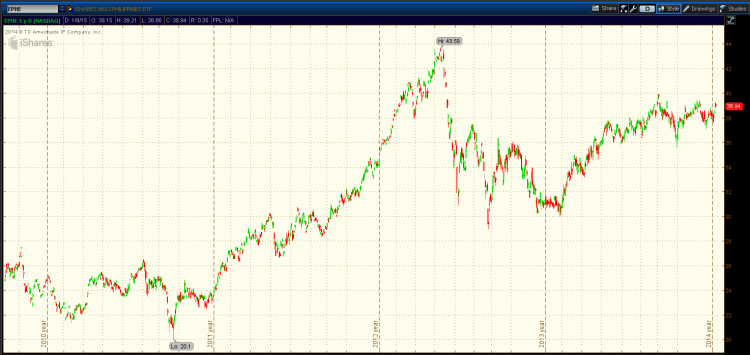
The long-term chart of EPHE gives some reference. The all-time high is at $43.59, so this could be a potential resistance point following a breakout above $40. If the symmetrical triangle fails and price breaks lower, then the early 2014 lows in the low 30’s could be a support zone. This price area coincides with the 2012 highs before the big move higher to the all-time high.
Philippines ETF (EPHE) Long-Term Chart
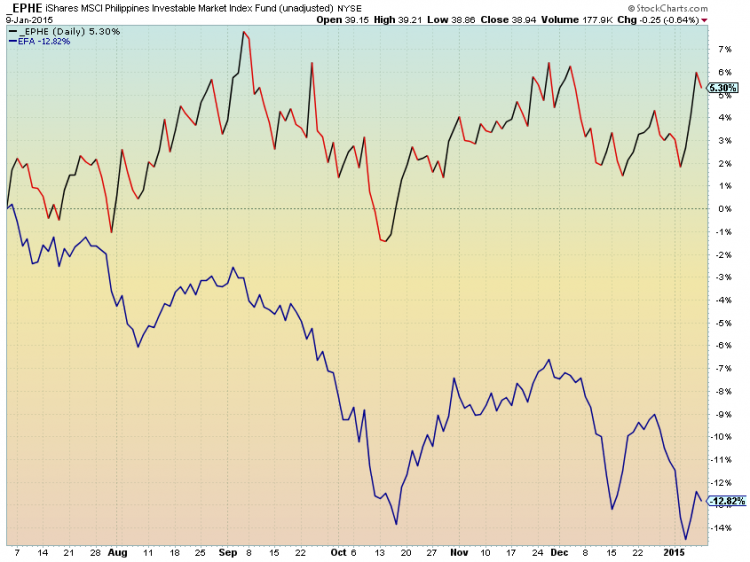
Looking at EPHE from a relative basis, it has crushed the iShares MSCI EAFE ETF (EFA) and the Emerging Markets ETF (EEM). Since July of 2014, EPHE has held steady with gains while international stock market has declined.
EPHE vs EFA Cumulative Chart Performance
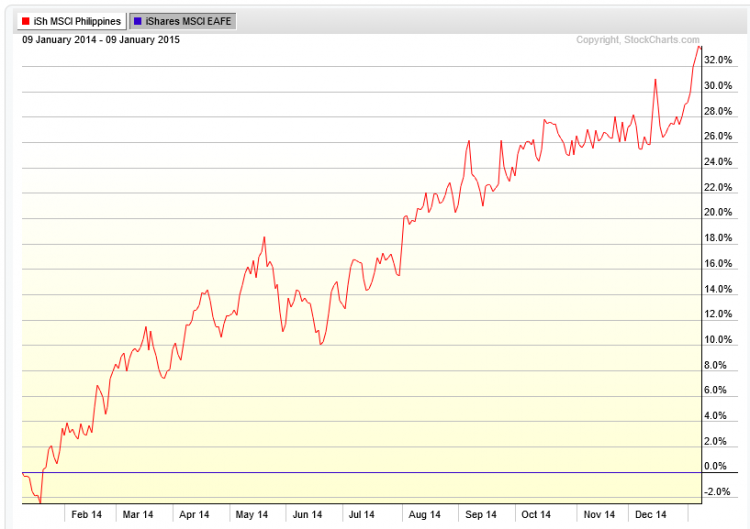
The below one-year relative chart shows how EPHE has recently taken another leg higher in relative strength versus EFA.
EPHE vs EFA Relative Strength Chart
Thanks for reading and have a great week!
Follow Mike on Twitter: @MikeZaccardi
No position in any of the mentioned securities at the time of publication. Any opinions expressed herein are solely those of the author, and do not in any way represent the views or opinions of any other person or entity.


