It’s been a relentless crash in energy stocks as some have fallen 70 to 80 percent from their highs. And from peak to trough the SPDR Energy ETF (XLE) dropped 27 percent.
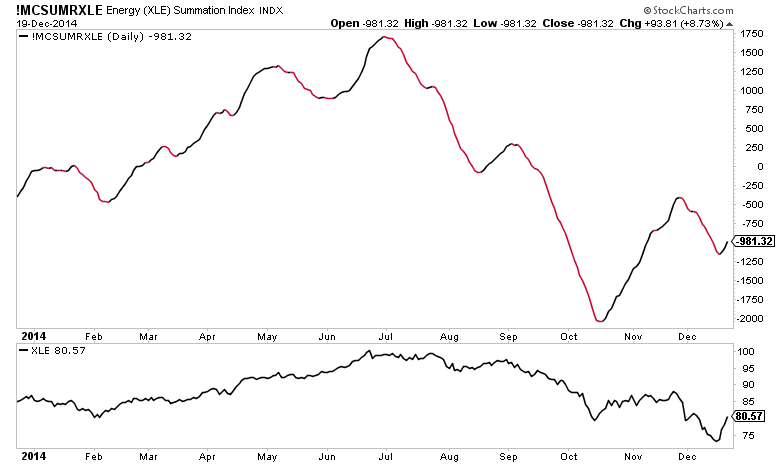
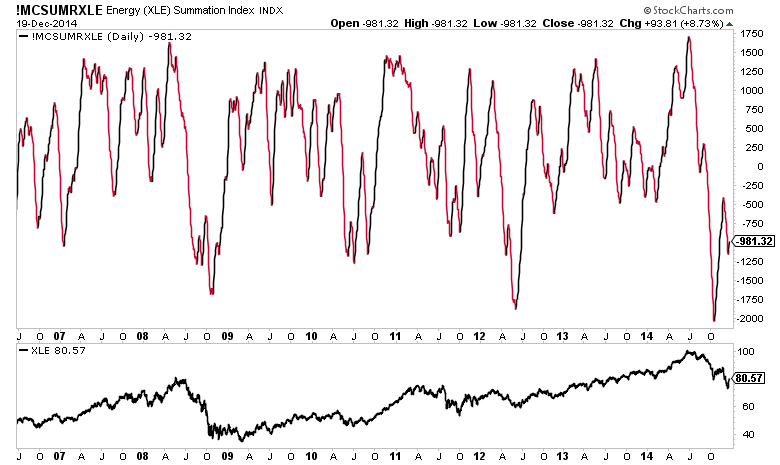
During the most recent drop in energy stocks, The McClellan Summation Index of XLE components flashed a massive bullish divergence. If you’re not familiar, this can be indicative of tired selling (exhaustion) via waning breadth on an intermediate term basis. Check out the chart of the energy summation index below.
In October, the energy summation index reached an incredibly oversold level. In fact, by this measure energy was more oversold than any point during the 2008 decline.
We can’t suggest, based on this indicator alone, we have a bottom. However, late in the week we saw what appears to be price confirmation in XLE.
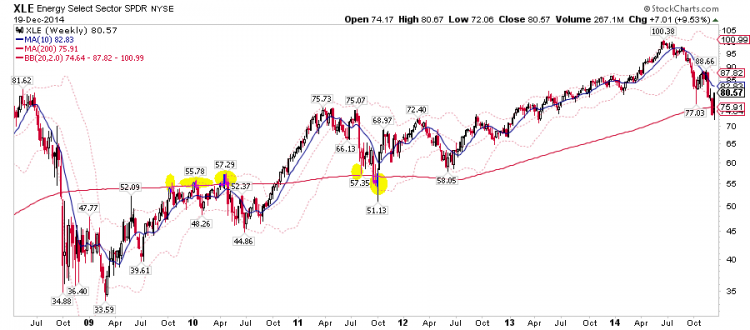
Looking at XLE, we see it formed a bullish engulfing week at the 200 week moving average. It’s respected this area in the past which adds some strength to the floor. Also note it re-captured the October lows.
We also have to consider the nature of the markets since the 2009 bottom. The markets seem to over exaggerate almost every negative. Also, the selling may have been exaggerated as money managers get energy stocks off their books.
The biggest takeaway here is $74-$78 is a significant floor in XLE. In this instance, we have a confluence of factors confirming the Energy Summation Index’s signal. Perhaps we’ve just seen a major bottom in energy.
Read more about the McClellan summation index on mcoscillator.com and stockcharts.com.
Thanks for reading!
Follow Aaron on Twitter: @ATMcharts
No position in any of the mentioned securities at the time of publication. Any opinions expressed herein are solely those of the author, and do not in any way represent the views or opinions of any other person or entity.


