 By Andrew Nyquist
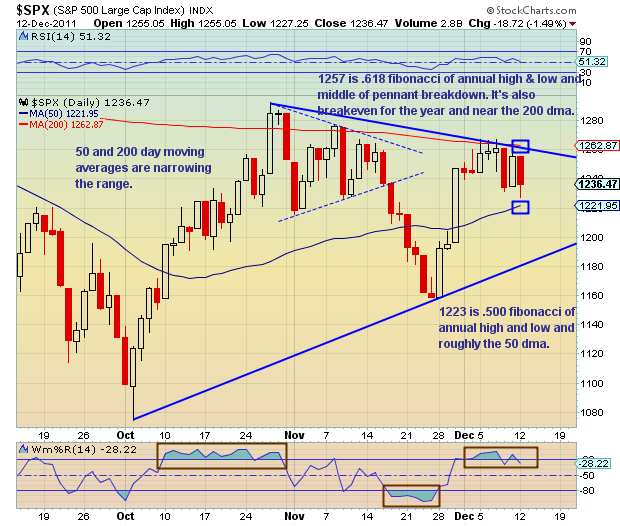
Futures pushed higher this morning indicating a morning hop. But indecision is still high and the market is nearing an inflection point. The past few days have found the market playing ping pong (down, up, down), and this has only served to further entrench The S&P 500 within its narrowing range (between the 50 and 200 day moving averages).
Happy investing.
———————————————————
Your comments and emails are welcome. Readers can contact me directly at andrew@seeitmarket.com or follow me on Twitter on @andrewnyquist. For current news and updates, be sure to “Like” See It Market on Facebook. Thank you.
Position in S&P 500 related index fund (SPY) at time of publication.
Any opinions expressed herein are solely those of the author, and do not in any way represent the views or opinions of his employer or any other person or entity.


