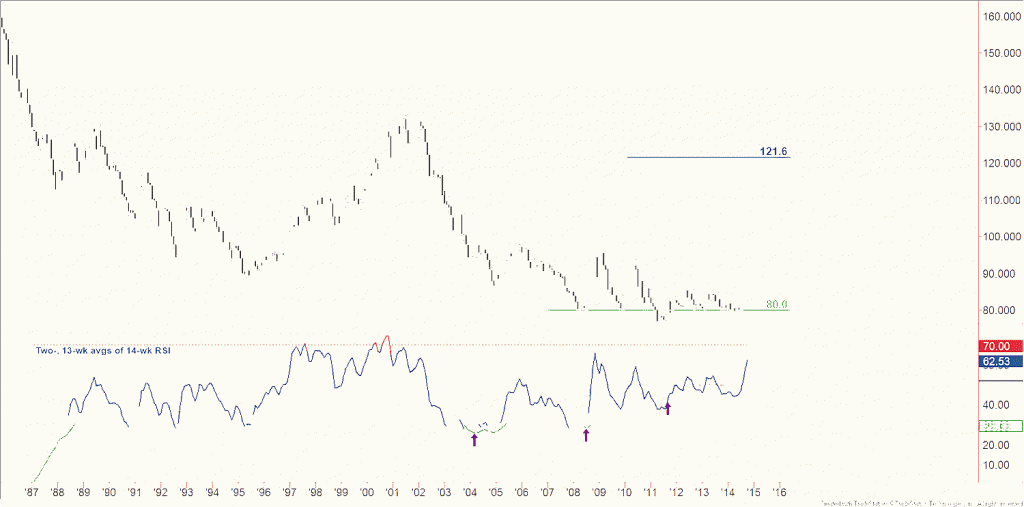
 For six and a half years the US Dollar Index (DX) has trended sideways. The technical signs on the wall favor this trend resolving higher. If that panned out and the next cyclical bull trend were akin to the last one when the 20th century was coming to a close, we’d be looking at upside potential to 121.6. This outlook has implications for foreign exchange traders – there could be opportunities to go short the euro and/or the yen – and those who trade commodities that tend to move inversely to the greenback such as gold and silver.
Let’s start with the evidence favoring a break higher in the long term for the US Dollar. Since 2008 DX hasn’t sustained losses beneath a floor around 80.0. More recently, price has cleared the highs in 2013 and 2012. So the floor confirms an absence of selling interest beneath 80, and the recent rally confirms a crowd willingness to buy at higher prices.
Second, momentum is bullish (I measure momentum with fast and slow averages of the 14-month relative strength index). Granted, momentum improves during a pause in a downtrend just the same as it does during basing activity that can reverse a downtrend. So you have to be careful to see which situations are neutral and which are bullish. In this case, two factors point to a bullish scenario. First, the purple arrows denote rising lows in the slow RSI average, which did fall to oversold conditions signaling seller exhaustion, even as price fell to lower lows. Second, recently the fast RSI average shot far above the 50 midline. That strength heightens the odds of further upside in price. Consider the opposite case, in a downtrend: RSI averages tend to stall around the midline and ultimately turn down, along with price.
Finally, take a look at the light blue arcs. The one on the left shows the last cyclical bull market from 1995 to 2001. Applying that magnitude to the 2008 low brings us to 121.6. That certainly makes for an aggressive forecast, but it’s a reasonable one based on what history tells us.
US Dollar Index Chart
That’s a good segue into my last point. Outlooks for the decade ahead are inherently lofty and are no substitute for sound trading/investing rules. That means specific criteria for when to get in and when to get out that don’t involve your emotions, and strict guidelines into money management, including position sizes and portfolio risk in addition to risk on an individual trade. Consider this outlook and the accompanying chart as a guide for which side of the market to be trading. I won’t consider the bullish outlook for the US Dollar (DX) to be threatened unless price gets below 82.8 – the September low. September sported a tall bullish belt hold candlestick and breaching its low would wipe out the bullish implications. Absent that unlikely scenario, this market stays bullish.
The towering trees of Northwest Philly are alight with fall colors. I hope the day is as beautiful where you are. Good weekend and good trading, everyone.
Follow Chris on Twitter: @ChrisBurbaCMT
No position in any of the mentioned securities at the time of publication. Any opinions expressed herein are solely those of the author, and do not in any way represent the views or opinions of any other person or entity.


