 Here’s what I know … Yahoo (YHOO) is going to make billions on the Alibaba (BABA) IPO.
I also know Price Patterns. The following charts show the $48-$50 area to be the completion of a sell pattern for YHOO. I know two things for sure about the pattern: It’s either going to 1) WORK or 2) FAIL.
One thing is for sure, though… it’s going to be an interesting ride! The Alibaba IPO is currently set to price on September 18 and open on September 19, so buckle your seat belts.
Let’s turn to the charts and analyze the long-term patterning present in Yahoo’s stock price. A brief explanation of the patterns will accompany each chart.
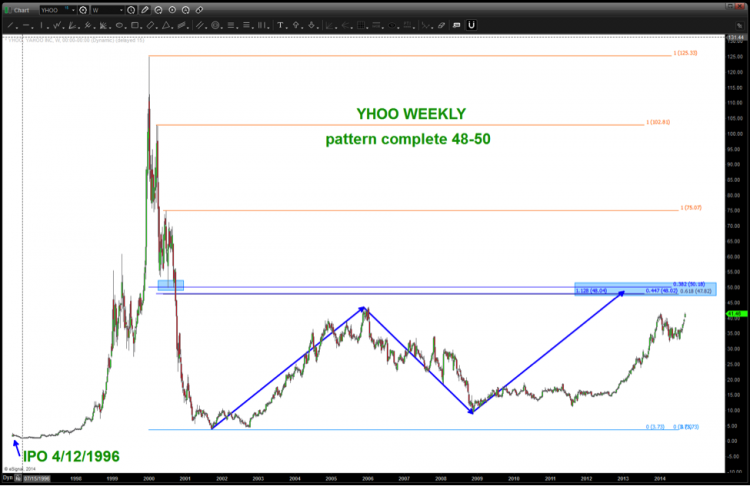
YHOO Weekly Chart
The key with this pattern is the confluence of 5 price ratios.
- Projection: basic technique targets the area highlighted in blue. (BLUE ARROWS)
- Retracement: using 3 nodes from the past we get .382 from all time high (50.18), .447 (48.02) and .618 (47.82).
- .447 is derived as follows
- 5, square root = 2.236, 1/ 2.236 = .447
- .447 is derived as follows
- Extension: 1.128 extension (48.04)
- Note, the low in 2009 was a .886 (square root of .786 = .886) retracement from the 2002-2006 swing high. If we calculate 1/.886 = 1.128.
- Also, note the blue area highlighted in the 2001 area. Polarity calls for support becoming resistance.
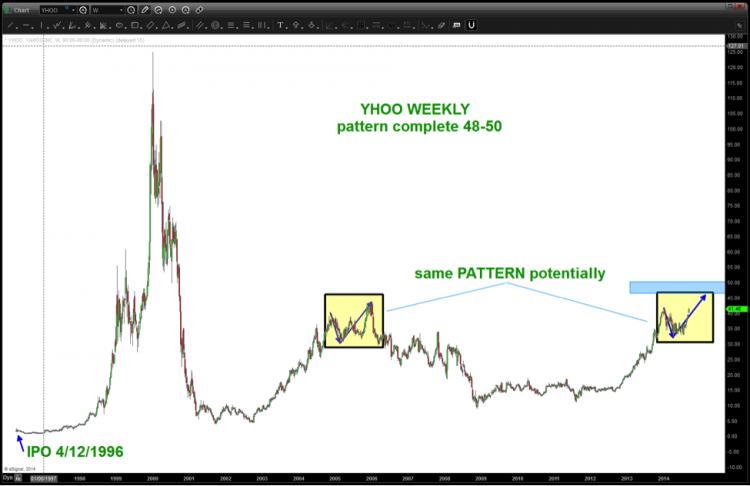
YHOO Weekly Chart – Similar Topping Pattern?
Sometimes, patterns repeat themselves at important inflection points. Right now, the pattern highlighted in yellow above is EXACT in PRICE and takes u right into our target zone of 48-50.
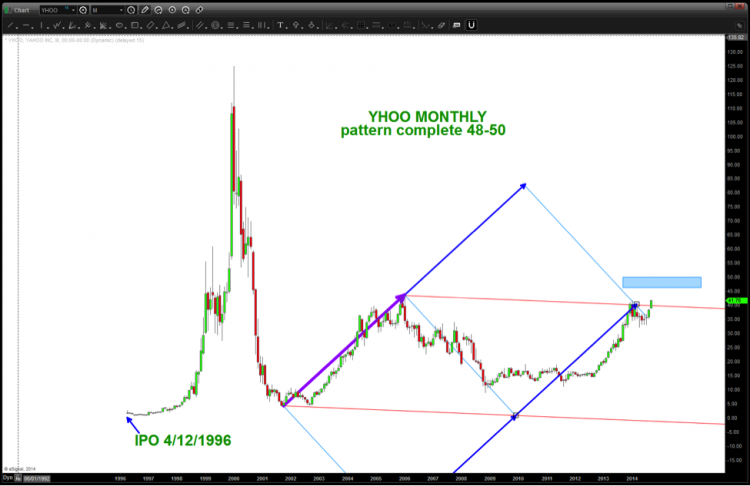
YHOO Monthly Chart – Price Pattern Geometry?
The initial impulse move (purple bolded arrow) is the key to the geometry of the entire move. Using “basic” 90 and 45 degree angles we can see that the recent move higher in YHOO is a “breakout” and we can also see how the convergence of the light blue and red trendline was the “cause” of the most recent resistance.
Keep an eye on this target zone over the coming days as the IPO madness grows for Alibaba stock.
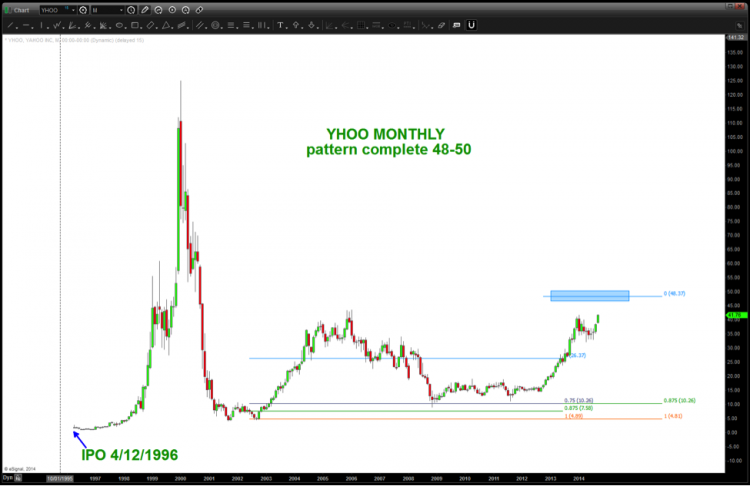
YHOO Monthly Chart
For your reference, I did a recent blog post around this technique, and the bottom line is by using the signal reversal candle that gave birth to this move in YHOO, I can also track my way to the target area shown. Another confirmation. Thanks for reading.
No position in any of the mentioned securities at the time of publication. Any opinions expressed herein are solely those of the author, and do not in any way represent the views or opinions of any other person or entity.


