 There were a number of bearish negative divergences emerging in the equity market complex for several weeks. Standing alone, each divergence carries relevance only at the margin, but as they grow the cumulative value becomes a primary market indicator. This may explain the recent volatility in the markets. Below are five examples.
- For several weeks the micro-cap & small-cap equity indexes were not confirming the new bull market highs of the larger cap equity indexes.
- Cumulative breadth and high yield indicators were not confirming new S&P 500 bull market price highs.
- RS leadership equity equities were stalling and resisting new price highs.
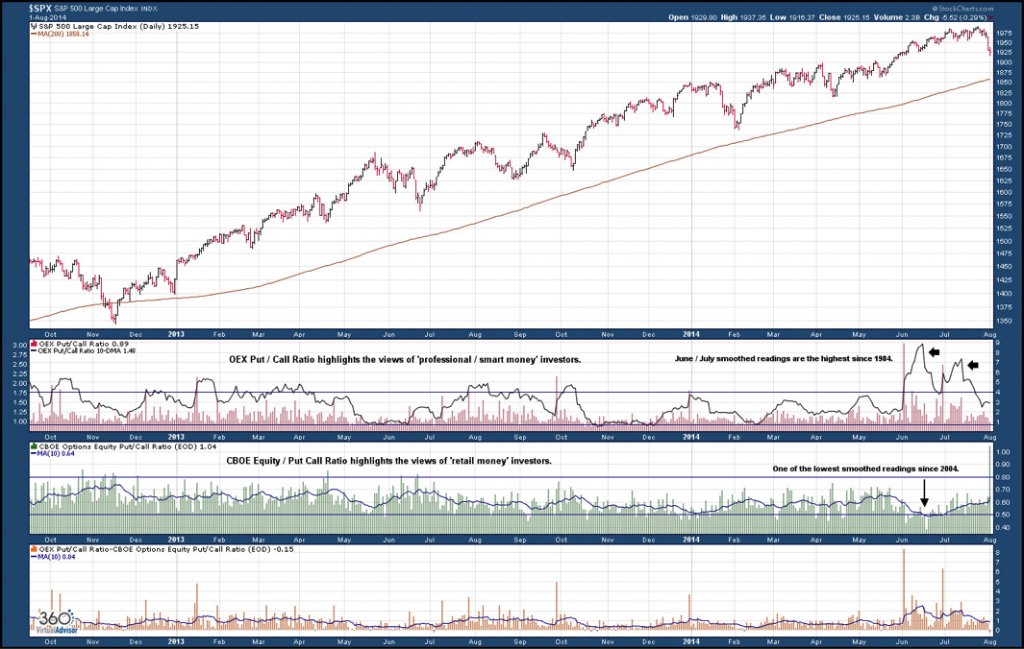
- Professional investors were accumulating protection against a drop in the equity market while retail investors were increasing risk exposure.
- Bearish momentum divergence on daily and weekly charts for the S&P 500.
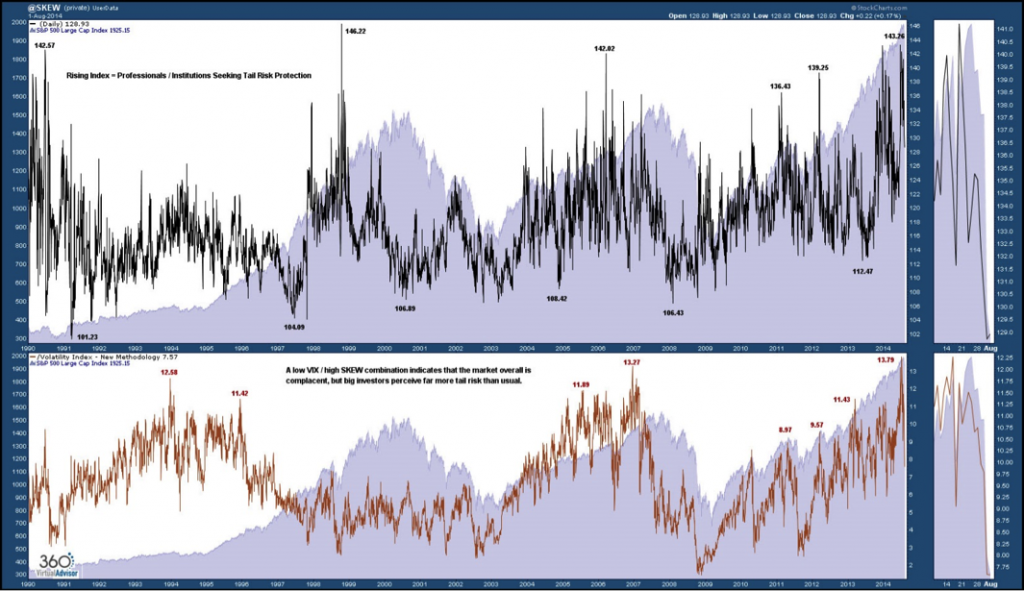
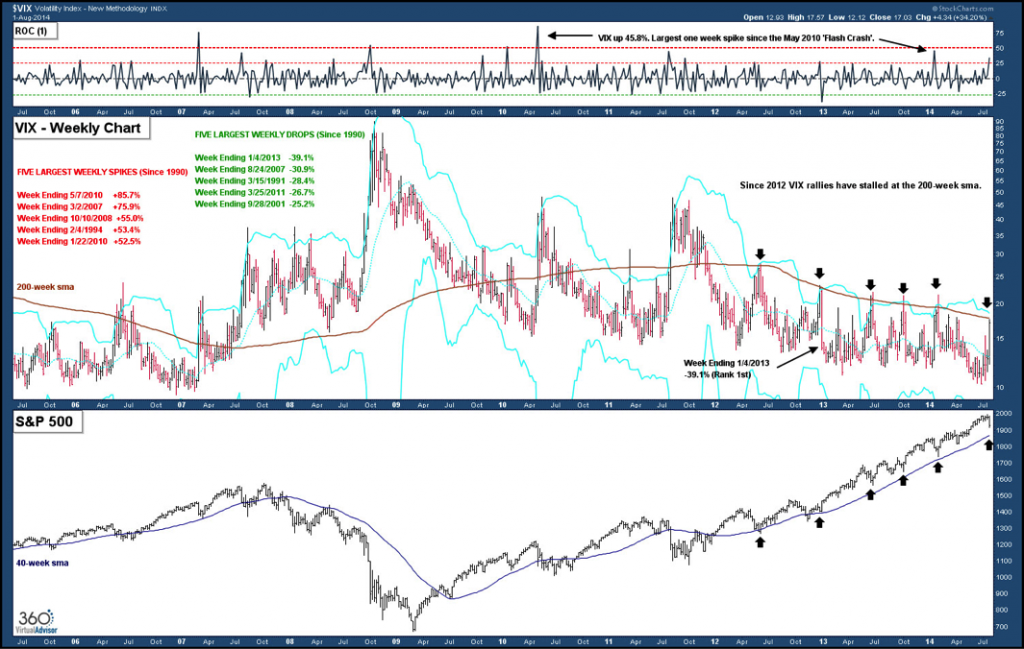
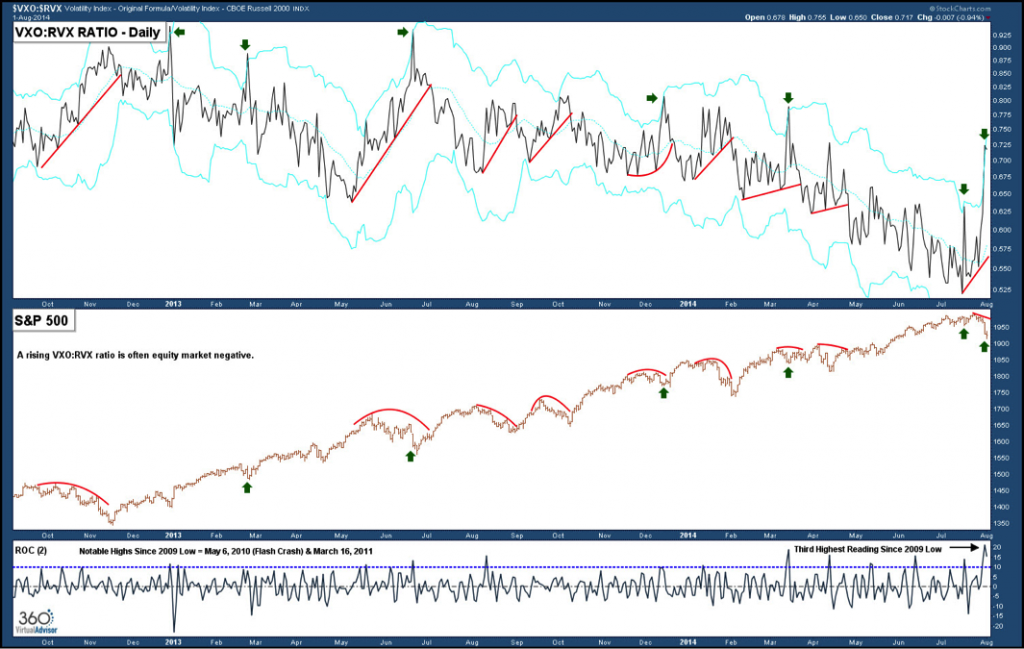
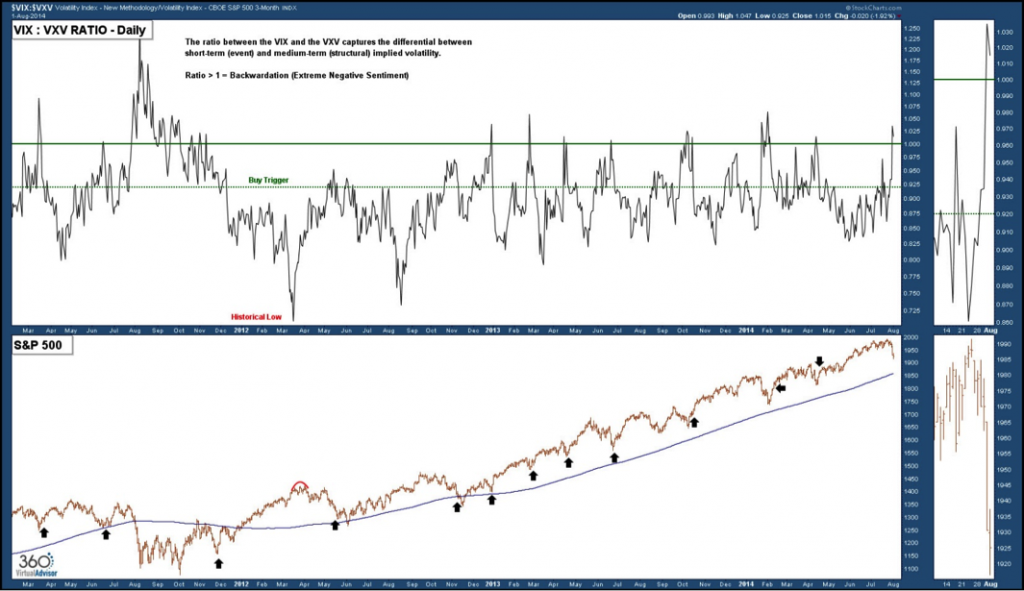
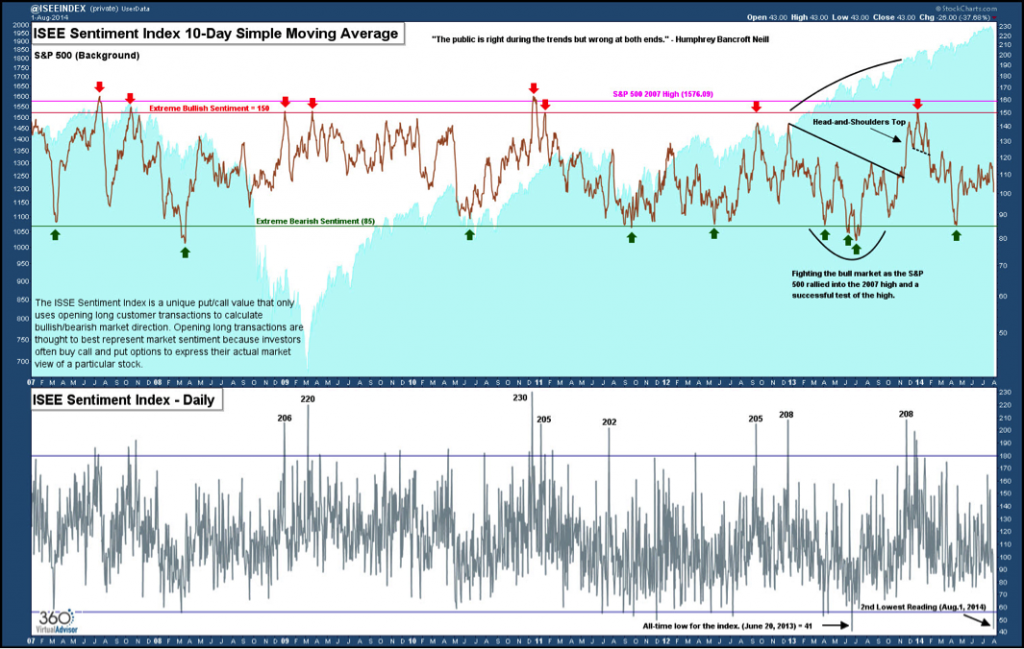
The following annotated charts focus on the volatility and sentiment indexes, highlighting the footprints of professional investors prior to last week and offering the conclusion that there is a high probability that the equity markets printed a short-term momentum low last week.
Professional / ‘Smart Money’ Investors vs. Retail Investors Divergence
VIX Volatility Index – 200 Week Moving Average In Play (6th Time Since mid-2012)
Large Cap Volatility : Small Cap Volatility Ratio
Event Volatility : Structural Volatility
ISEE Sentiment Index – 2nd Lowest Reading
The 360° Virtual Advisor Pole Position model portfolio is currently 30% net long. Holdings are LMT, FXI and EUO. The remaining 70% of the portfolio is held in cash. I personally hold a 100% cash position currently.
Follow Sheldon on Twitter: @hertcapital
Any opinions expressed herein are solely those of the author, and do not in any way represent the views or opinions of any other person or entity.

