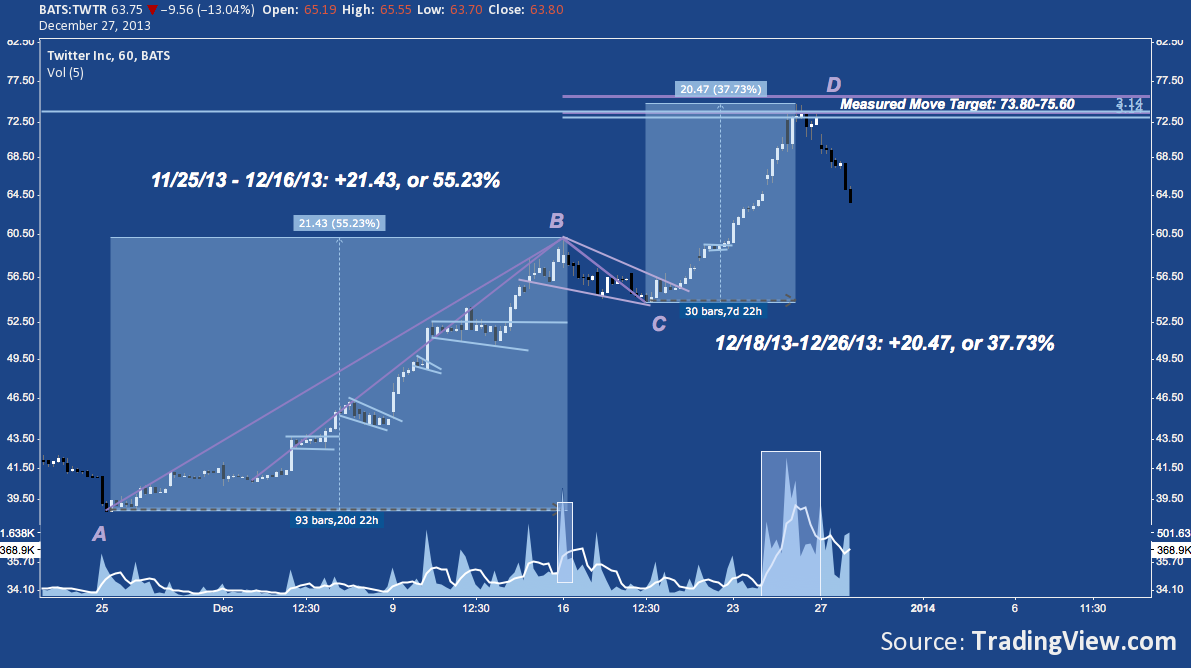
Twitter slid aggressively today, finishing down more than 9.5 points to close at $63.75, off 13.04% of yesterday’s $73.31 close. With today’s rout, the social media favorite (which only yesterday had appreciated into market cap territory rivaling over $40 Billion, greater than 80% of S&P 500 companies) – finds itself beak-deep in a classic example of a rapidly evolving (and devolving) climactic high-volume blow off.
Twitter Blow Off (TWTR) – Hourly: Measured Move Up
Here’s a play-by-play post-mortem of what just happened:
Off it’s post IPO low at $38.80 on 11/25/2013, TWTR embarked on the first leg of measured move up, accumulating over 21 points in just 21 trading days to peak at $60.23 on 12/16/2013, completing Leg AB above. For those keeping score, that’s 55.23% in just 4 weeks.
Sure that was the top? More than a few concluded as much: TWTR embarked on a 2 day, 10% correction pulling back as low as $54.25 on 12/18/2013. This move down – Leg BC – was a brief but well-defined bull pennant, only the largest and longest of no fewer than 4 other pennants and flags that serially consolidated leg AB’s run after breaking out over $42 on 12/04/2013.
This pennant gave way late on 12/19/2013 to Leg CD, setting up the measured move to $73.80-$75.60 (depending on whether point A’s plot is drawn at the absolute $38.80 low on 11/25 or the late-November/early-December congestion low at $42).
Leg CD’s character is very different than Leg AB. First: it features only one, lateral flag. Otherwise it is a single, unmitigated drive up. Instead of consolidations to digest the motive spikes higher featured in Leg AB, Leg CD includes 2 gaps higher – the first a measuring gap, the second a runaway gap.
Altogether, Leg CD cover 20.47 points, or 95.5% of Leg AB’s range; but accomplished this move in almost 1/3 of the duration.
And how did it happen?
In short; volume: relative to TWTR’s issued shares, a ton of it. Something similar occurred on 12/16 as the stock approached 60; but this time the swell of shares turning over dwarfed that day, even surpassing the common stock’s float. This event is all the more noteworthy because it occurred over one of the quietest times of the year (late 12/23 through 12/26) for the broader market.
Ultimately, a combination of a low quantity of issued shares, large blocks of a float still in IPO lockup, forced low short interest and major buzz across market segments created the conditions in TWTR for a tight and accelerated melt-up. Virtuous market dynamics for a blistering long trade; but one built for only the most nimble and opportunistic.
In the end, 12/26 produced a huge hanging man candlestick (on the daily) – a sign of indecision carrying the potential to strand all those who accumulated long positions in the rush on 12/26 if a gap-down and run lower occurred the following session. From the open of pre-market today (12/27), that’s exactly what happened, with TWTR going out only a nickel off its absolute low at $63.70. Extended market trade turned the knife a bit further, shedding 1% before flat-lining around $63.05 into the weekend.
Was that “the top” for Twitter?
That’s anyone’s guess; and for active investors or traders with a shorter time horizon, it’s of merely academic interest.
A more constructive question might be: “In the context of a still clear-and-present up trend, how far might TWTR correct?” A reasonable primary trend correction to the 38.2% retracement off the top takes TWTR down to $60.90, just shy of point B at $60.23. Though that seems a good distance away, it is just a small fraction of today’s move. Below that, the 50% retracement of A-to-D lies at $56.75, just above point C at $54.25.
Twitter: @andrewunknown and @seeitmarket
Author holds net short exposure to TWTR at time of publication.
Any opinions expressed herein are solely those of the author, and do not in any way represent the views or opinions of any other person or entity.


