 If your focus is asset allocation and you’re not concerned with market timing, you don’t need to bother reading any further. As the research on efficient frontier shows, including commodities in your asset allocation is a benefit in the long run in terms of return for a given level of risk. However, if you do shift your allocation actively, there are technical reasons to have little or no allocation to commodities markets right now; i.e. avoid commodities.
As the recovery from the depths of the financial crisis found its legs, a lot of us were lulled into thinking risk-on always involved buying stocks, the euro and commodities. And for a while it did. But that nice, clean risk-on/risk-off phenomenon which was easy for market reporters to write about (and the high correlations that drove hedge funds crazy) ended earlier this year. Major stock market indices continue to find new highs while commodities are sucking wind. And these are but a few reasons to avoid commodities at present. So let’s dig a little deeper.
Greenhaven Continuous Commodity Index Fund (GCC) is a good gauge of the broader performance of the commodities markets for two related reasons. One, it’s based on the Thomson Reuters Equal Weight Continuous Commodity Total Return Index, so its performance isn’t disproportionally influenced by any one market. In contrast, some commodity exchange traded products are heavily influenced by energy futures, for example. Second, the allocation is fairly balanced across individual spaces within commodities: 24% to soft commodities; 34% to agriculture; 24% to metals; and 18% to energy.
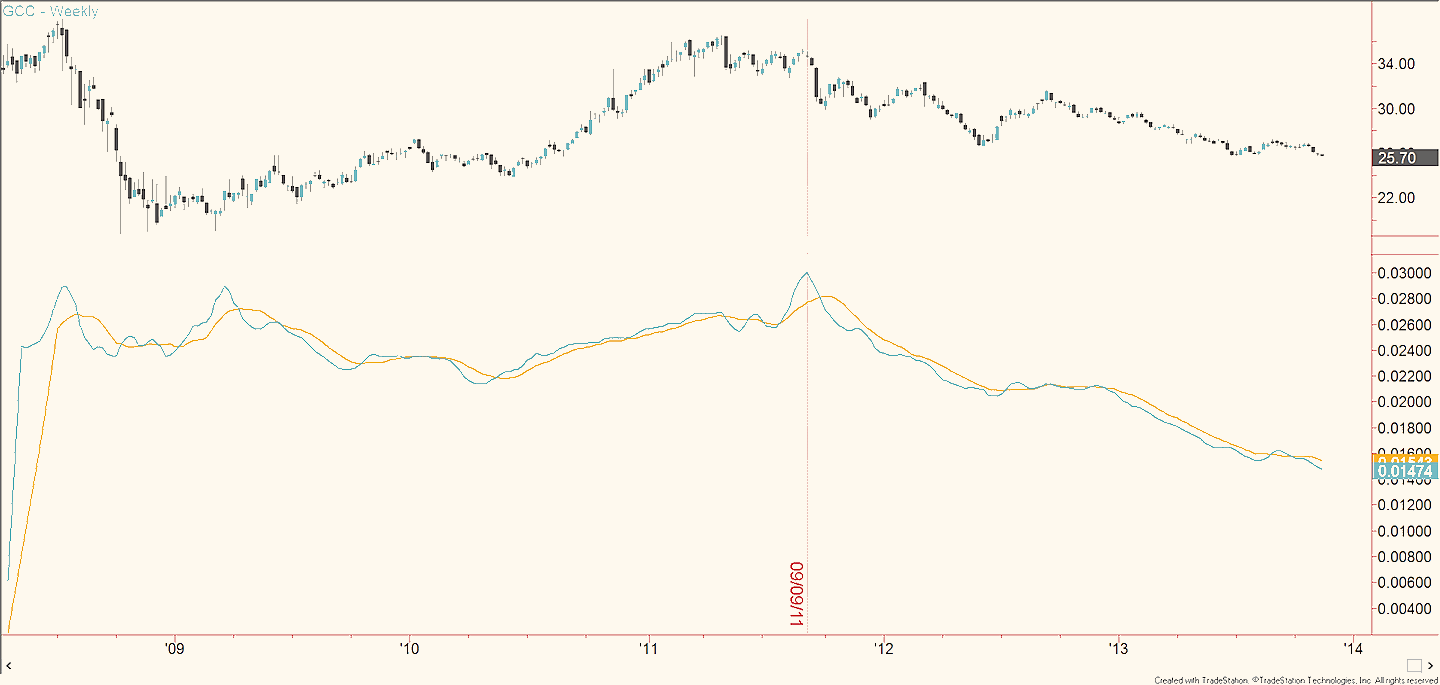
Below is the chart I want to show you. On top is a weekly candlestick chart of GCC. The ETF fell to its lowest reading since July 2010 this week. You never want to be buying at multi-year lows unless a base is forming, and there isn’t any evidence of that.
GCC Weekly Chart – Commodities
 Chart Source: TradeStation
Additionally, the indicator at the bottom of the chart shows GCC has been out of favor for some time and there isn’t any sign of improvement. The light blue line is a four-week moving average of the relative strength line dividing GCC by S&P 500 Depository Receipts (SPY). The orange line is a 12-week moving average. Incorporating both lines, you can see how GCC has been performing relative to SPY over the past month and past quarter, on a rolling basis.
It’s a pretty clear picture: GCC has been underperforming since September 2011. The two RS average lines are at lower lows. Again, reasons to avoid commodities right now.
Incorporating relative strength is one key way to build a portfolio with assets that are in favor and avoiding those that are out of favor. Right now, your best course is identifying stocks or ETFs that show the best relative strength trends versus the S&P 500 or SPY, and perhaps to avoid commodities altogether.
Good trading, everyone.
Twitter: @ChrisBurbaCMT
No position in any of the securities mentioned at the time of publication. Any opinions expressed herein are solely those of the author, and do not in any way represent the views or opinions of any other person or entity.


