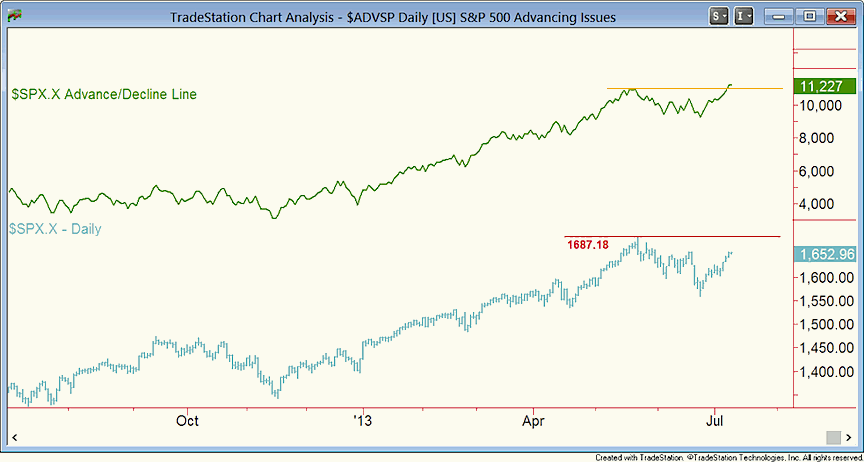
 While the S&P 500 is still off its record highs of 1687.18 set on 5/22, the Advance Decline line has already reached a new high. This indicator shows the running tally of advancing issues minus declining issues each day. The nominal value doesn’t matter but direction does, and so do new highs or new lows.
The fact that the Advance Decline line has already reached a new high affirms the primary uptrend in the S&P 500 since March 2009 by showing demand improving across the components of the index. See chart below – click to enlarge image.
The Advance Decline line should act as a leading indicator for SPX. Against this backdrop, position traders and investors should be doing their homework now to determine what areas outperformed the broader stock market during the 5/22-6/24 downtrend, as these are likely to lead on the way out. As I mentioned yesterday, KRE is on my watchlist at miAnalysis: https://mianalysis.com/you-need-to-own-kre-but-not-just-yet/.
Have a great day and thanks for reading.
Twitter: @ChrisBurbaCMT and @seeitmarket
Chart Source: TradeStation
Any opinions expressed herein are solely those of the author, and do not in any way represent the views or opinions of any other person or entity.


