 By Sheldon McIntyre
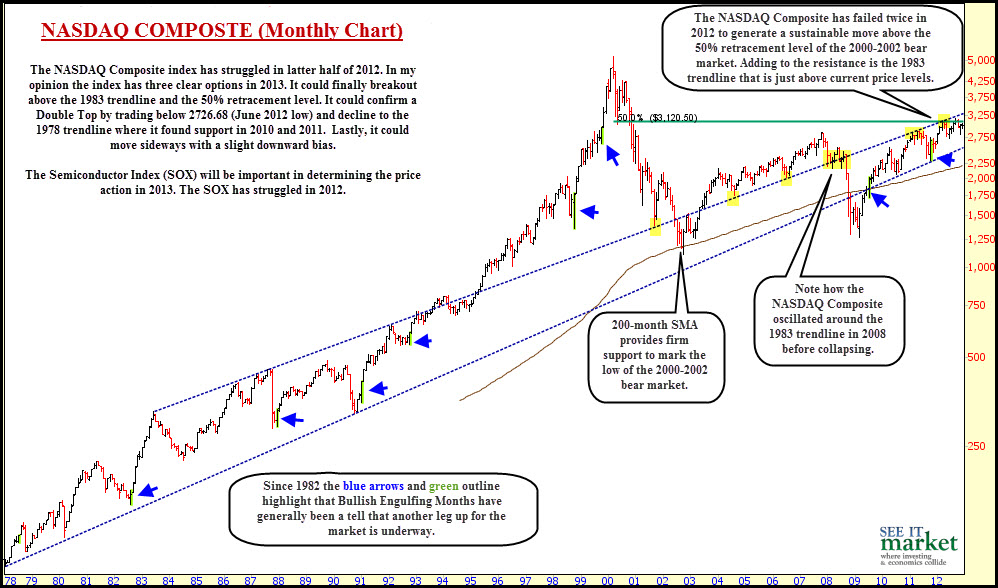
In 2012 we were reminded of the magnitude of the NASDAQ Composite decline during the 2000-2002 bear market. In March 2012 the index rallied to the 50 percent retracement level of the foresaid bear market before falling into a correction. In September 2012 and October 2012 the index revisited the 50 percent retracement, but failed again to hold this key technical level, thus highlighting the potential for a Nasdaq inflection point.
Heading into 2013 I see three clear options for the NASDAQ Composite:
1. The index could finally push above the 50 percent retracement of the 2000-2002 bear market and the 1983 trend line.
2. The index could confirm a Double Top and Nasdaq inflection point by trading below 2726.68 (the June 2012 low). This would set up the potential for a decline to the 1978 trend line where it found support in 2010 and 2011.
3. Lastly, it could trade sideways with a slight downward bias, also confirmation of a Nasdaq inflection point.
click on charts to enlarge
We should not overlook Semiconductor Index (SOX) and its importance to the outlook of the technology sector. The SOX has traded in a 100-point range since printing a high in February 2012. It has constantly found support at the 200-week SMA, but each bounce from the key long-term moving average has made a lower high. This needs to change if the NASDAQ is going to continue the 2009 bull market.
Related Reading by Sheldon McIntyre: “Market Analysis: Trend Health May Indicate September Inflection Point”
Twitter: @hertcapital @seeitmarket
No position in any of the securities mentioned at the time of publication.


