 By Andrew Nyquist
As the action continues to percolate (and on Fed day, no less), I thought it would be a good idea to provide a quick technical update to last week’s article “Stock Market Nearing Key Technical Juncture.”
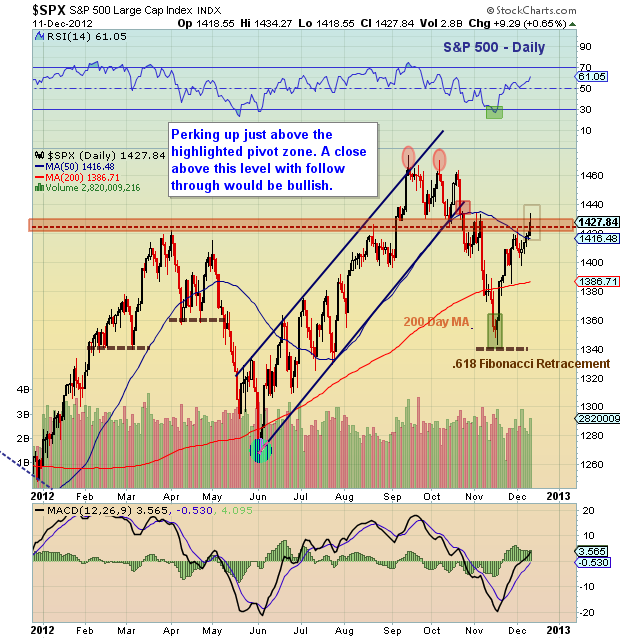
Below are charts for the S&P 500 and Nasdaq 100. As you can see, the S&P 500 is poking through the all important pivot range resistance. Closing above this area would be constructive. But with the Federal Reserve meeting, stay on your toes and be ready for increased price volatility that can last an extra day or two.
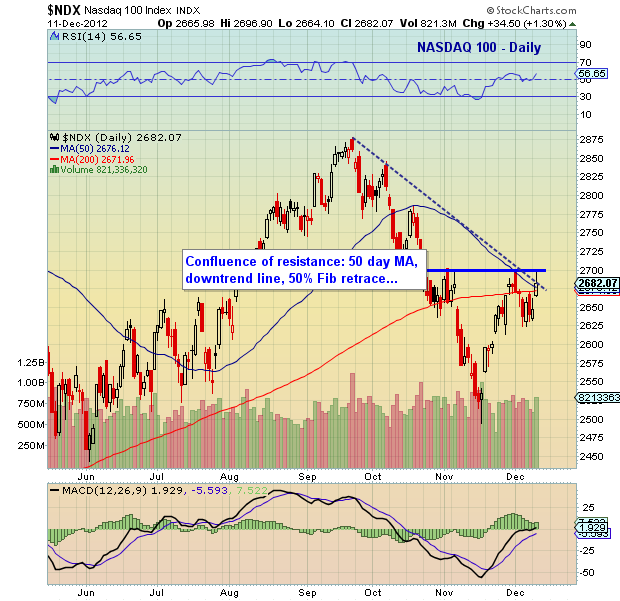
For this week, though, I am keying off the Nasdaq 100 chart. The index closed right at its downtrend line after touching the 50 percent Fibonacci retracement level and 2700. A close above 2700 would be bullish and go a long ways in repairing its technical setup. The market needs the Tech Sector to get healthy if it is going to make a run at new highs. No, Tech doesn’t need to lead nor reach new highs for the S&P 500 to hit new highs.
That’s all for now folks. Trade safe, trade disciplined.
Stock Market charts of the S&P 500 and Nasdaq 100 posted on December 12, 2012. Technical analysis with support and resistance levels.
Twitter: @andrewnyquist and @seeitmarket Facebook: See It Market
No position in any of the securities mentioned at the time of publication.
Any opinions expressed herein are solely those of the author, and do not in any way represent the views or opinions of his employer or any other person or entity.


