 By Andrew Nyquist
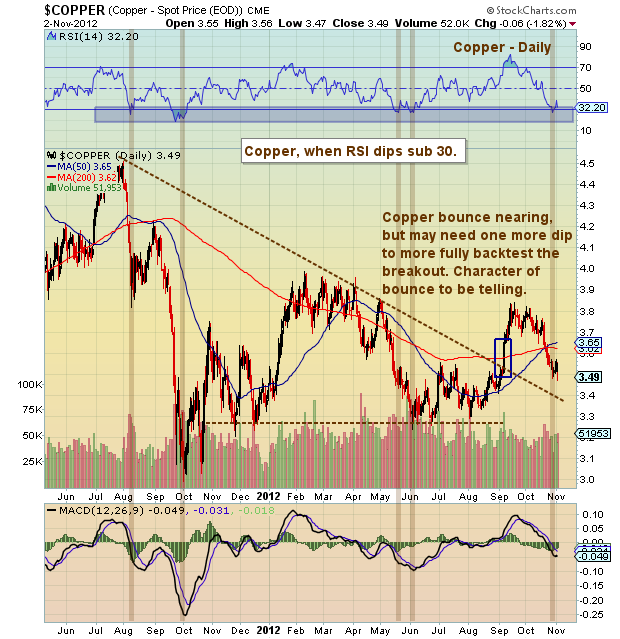
Copper has had a rough go of it lately. As the global financial markets have pulled in, Copper prices have dropped roughly 9 percent. Question is, how far might Dr. Copper have to fall before it catches a bounce? And are Copper prices trying to tell us something about the health of the global economy?
Although Copper’s price action isn’t as revered for economic forecasting as it once was back in the day, investors would be wise to take notice. Copper prices appear to be nearing a short-term bottom, but it will be the character of the ensuing bounce that tells us how healthy Copper is… while perhaps providing insights into the health of the global economy as well.
Trade safe, trade disciplined.
More Charts here.
Copper spot price chart as of November 2, 2012. Copper chart with trend lines and technical support and resistance. Copper and the metals sector.
———————————————————
Twitter: @andrewnyquist and @seeitmarket Facebook: See It Market
No position in any of the securities mentioned at the time of publication.
Any opinions expressed herein are solely those of the author, and do not in any way represent the views or opinions of his employer or any other person or entity.


